调试测试
VS Code 调试器
🌐 VS Code debugger
我们推荐使用 VS Code 扩展 进行调试,以获得更好的开发体验。通过 VS Code 扩展,你可以直接在 VS Code 中调试测试,查看错误信息,设置断点并逐步执行测试。
🌐 We recommend using the VS Code Extension for debugging for a better developer experience. With the VS Code extension you can debug your tests right in VS Code, see error messages, set breakpoints and step through your tests.
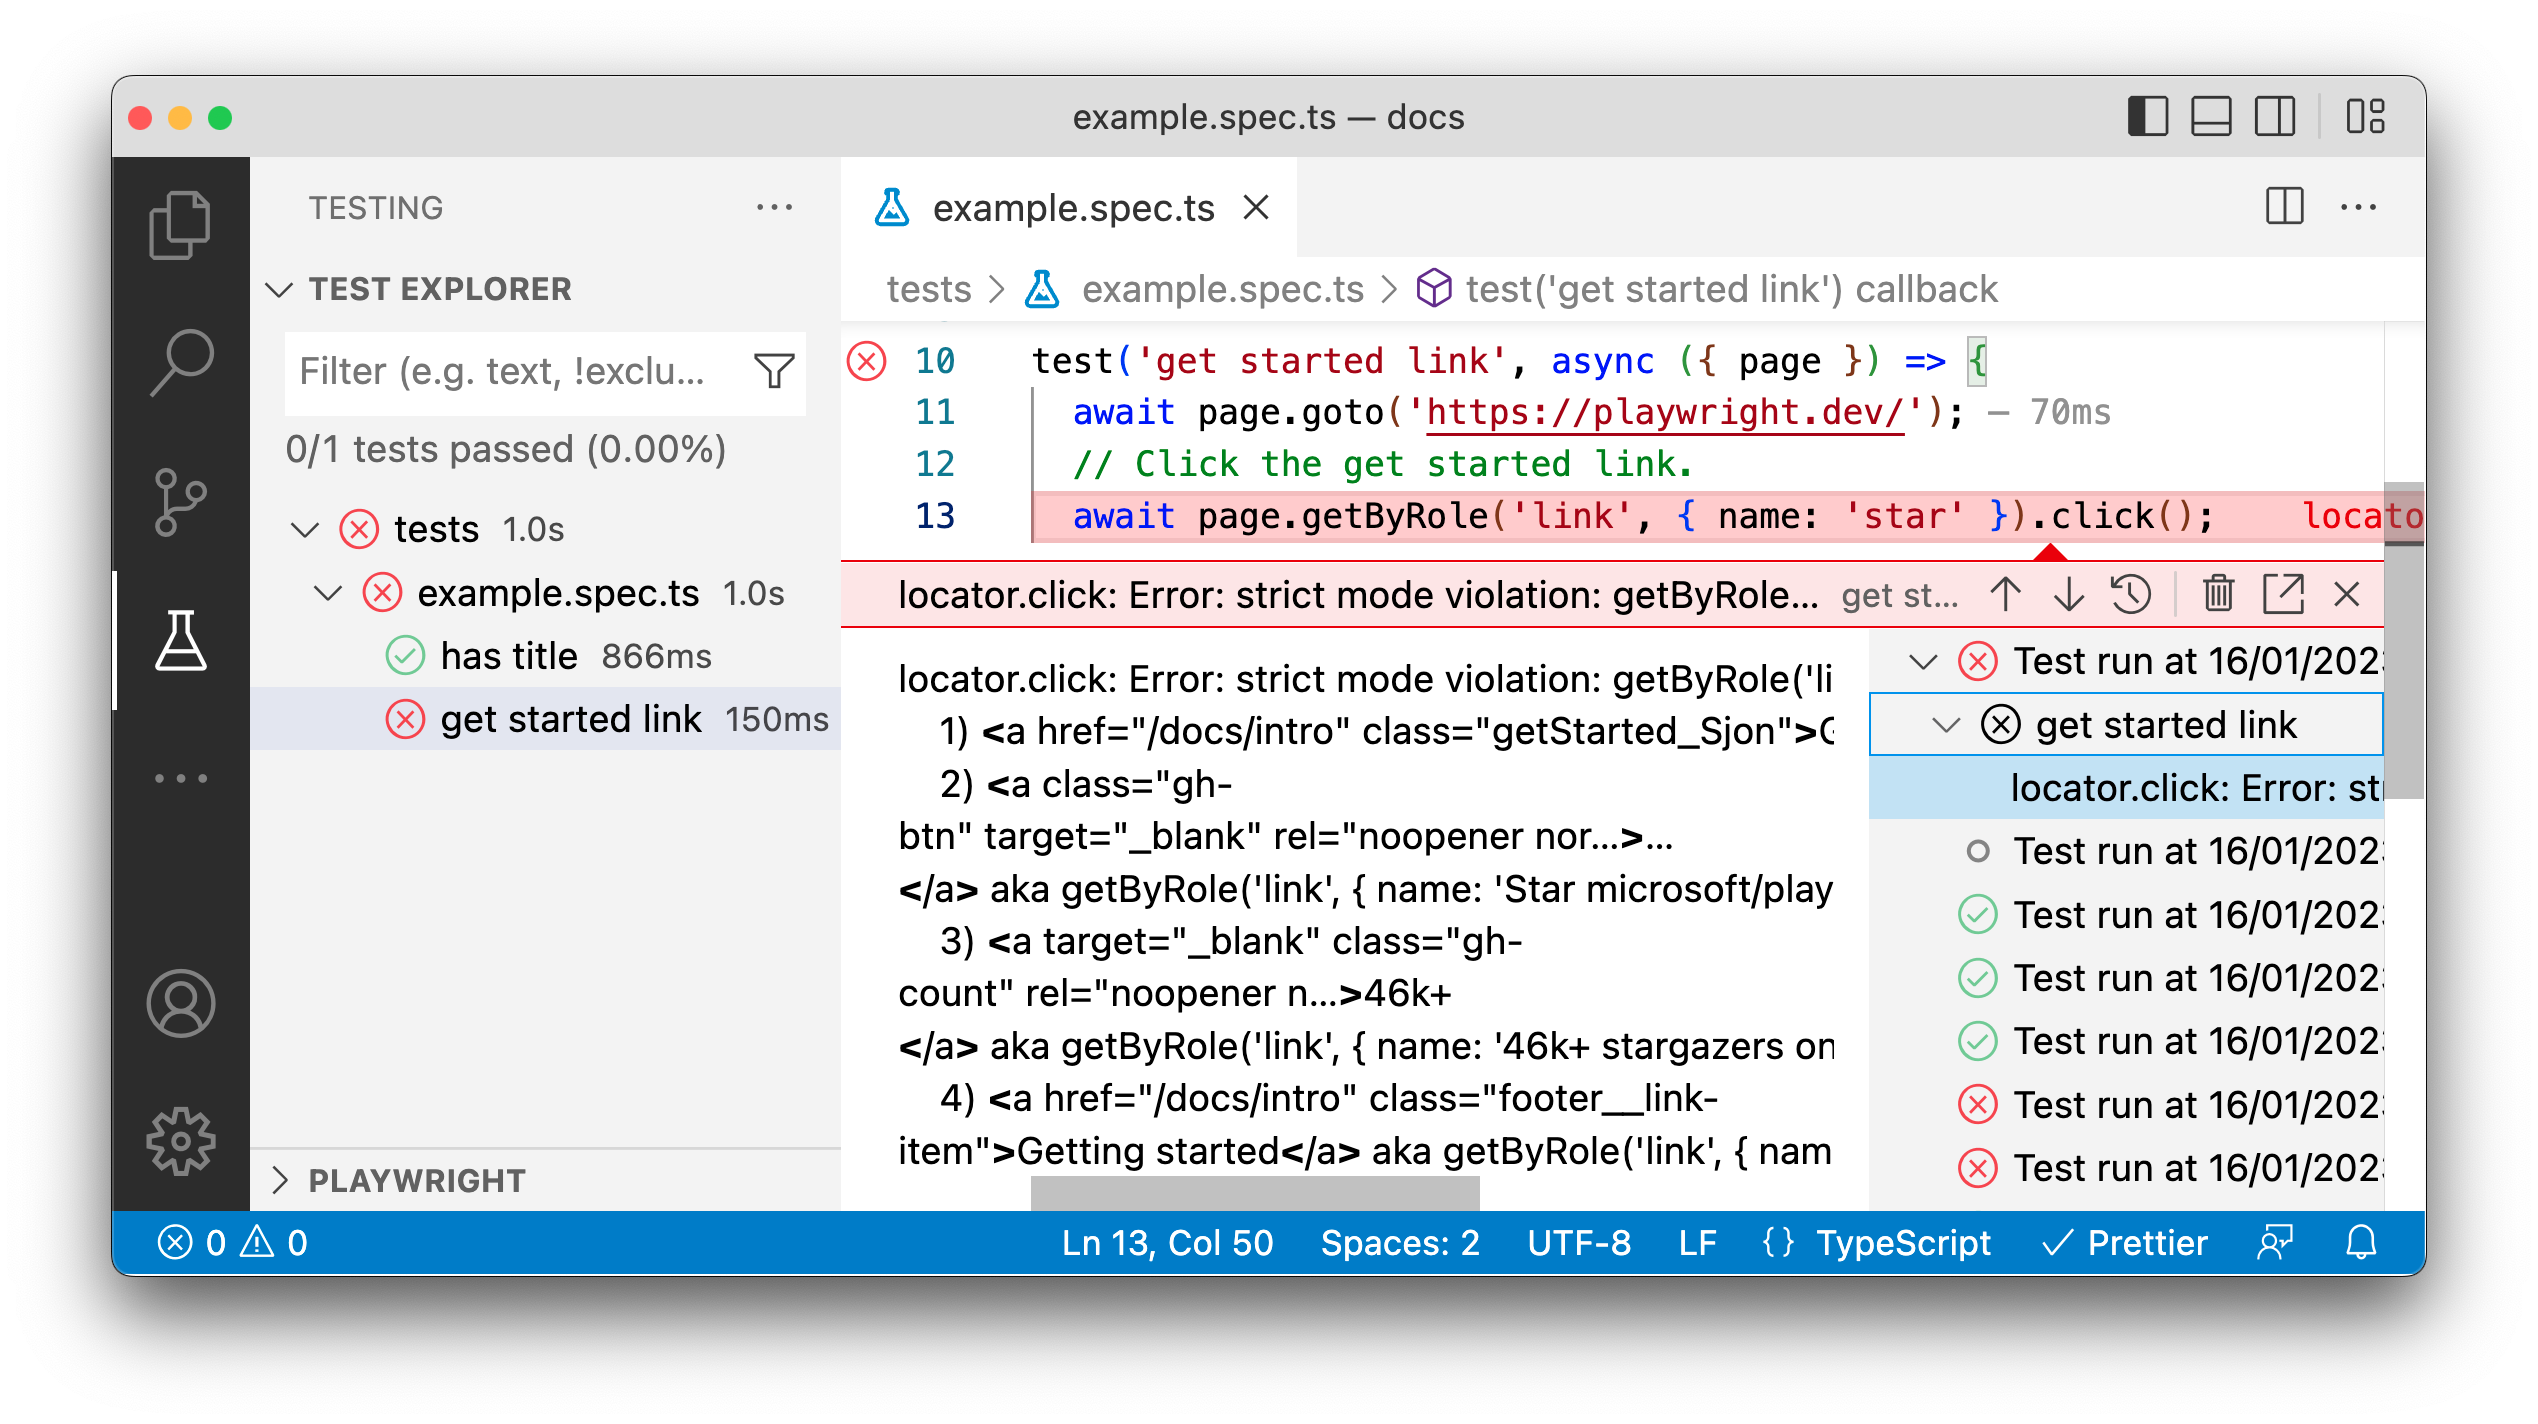
错误信息
🌐 Error Messages
如果你的测试失败,VS Code 将在编辑器中直接向你显示错误消息,显示预期的内容、收到的内容以及完整的调用日志。
🌐 If your test fails VS Code will show you error messages right in the editor showing what was expected, what was received as well as a complete call log.
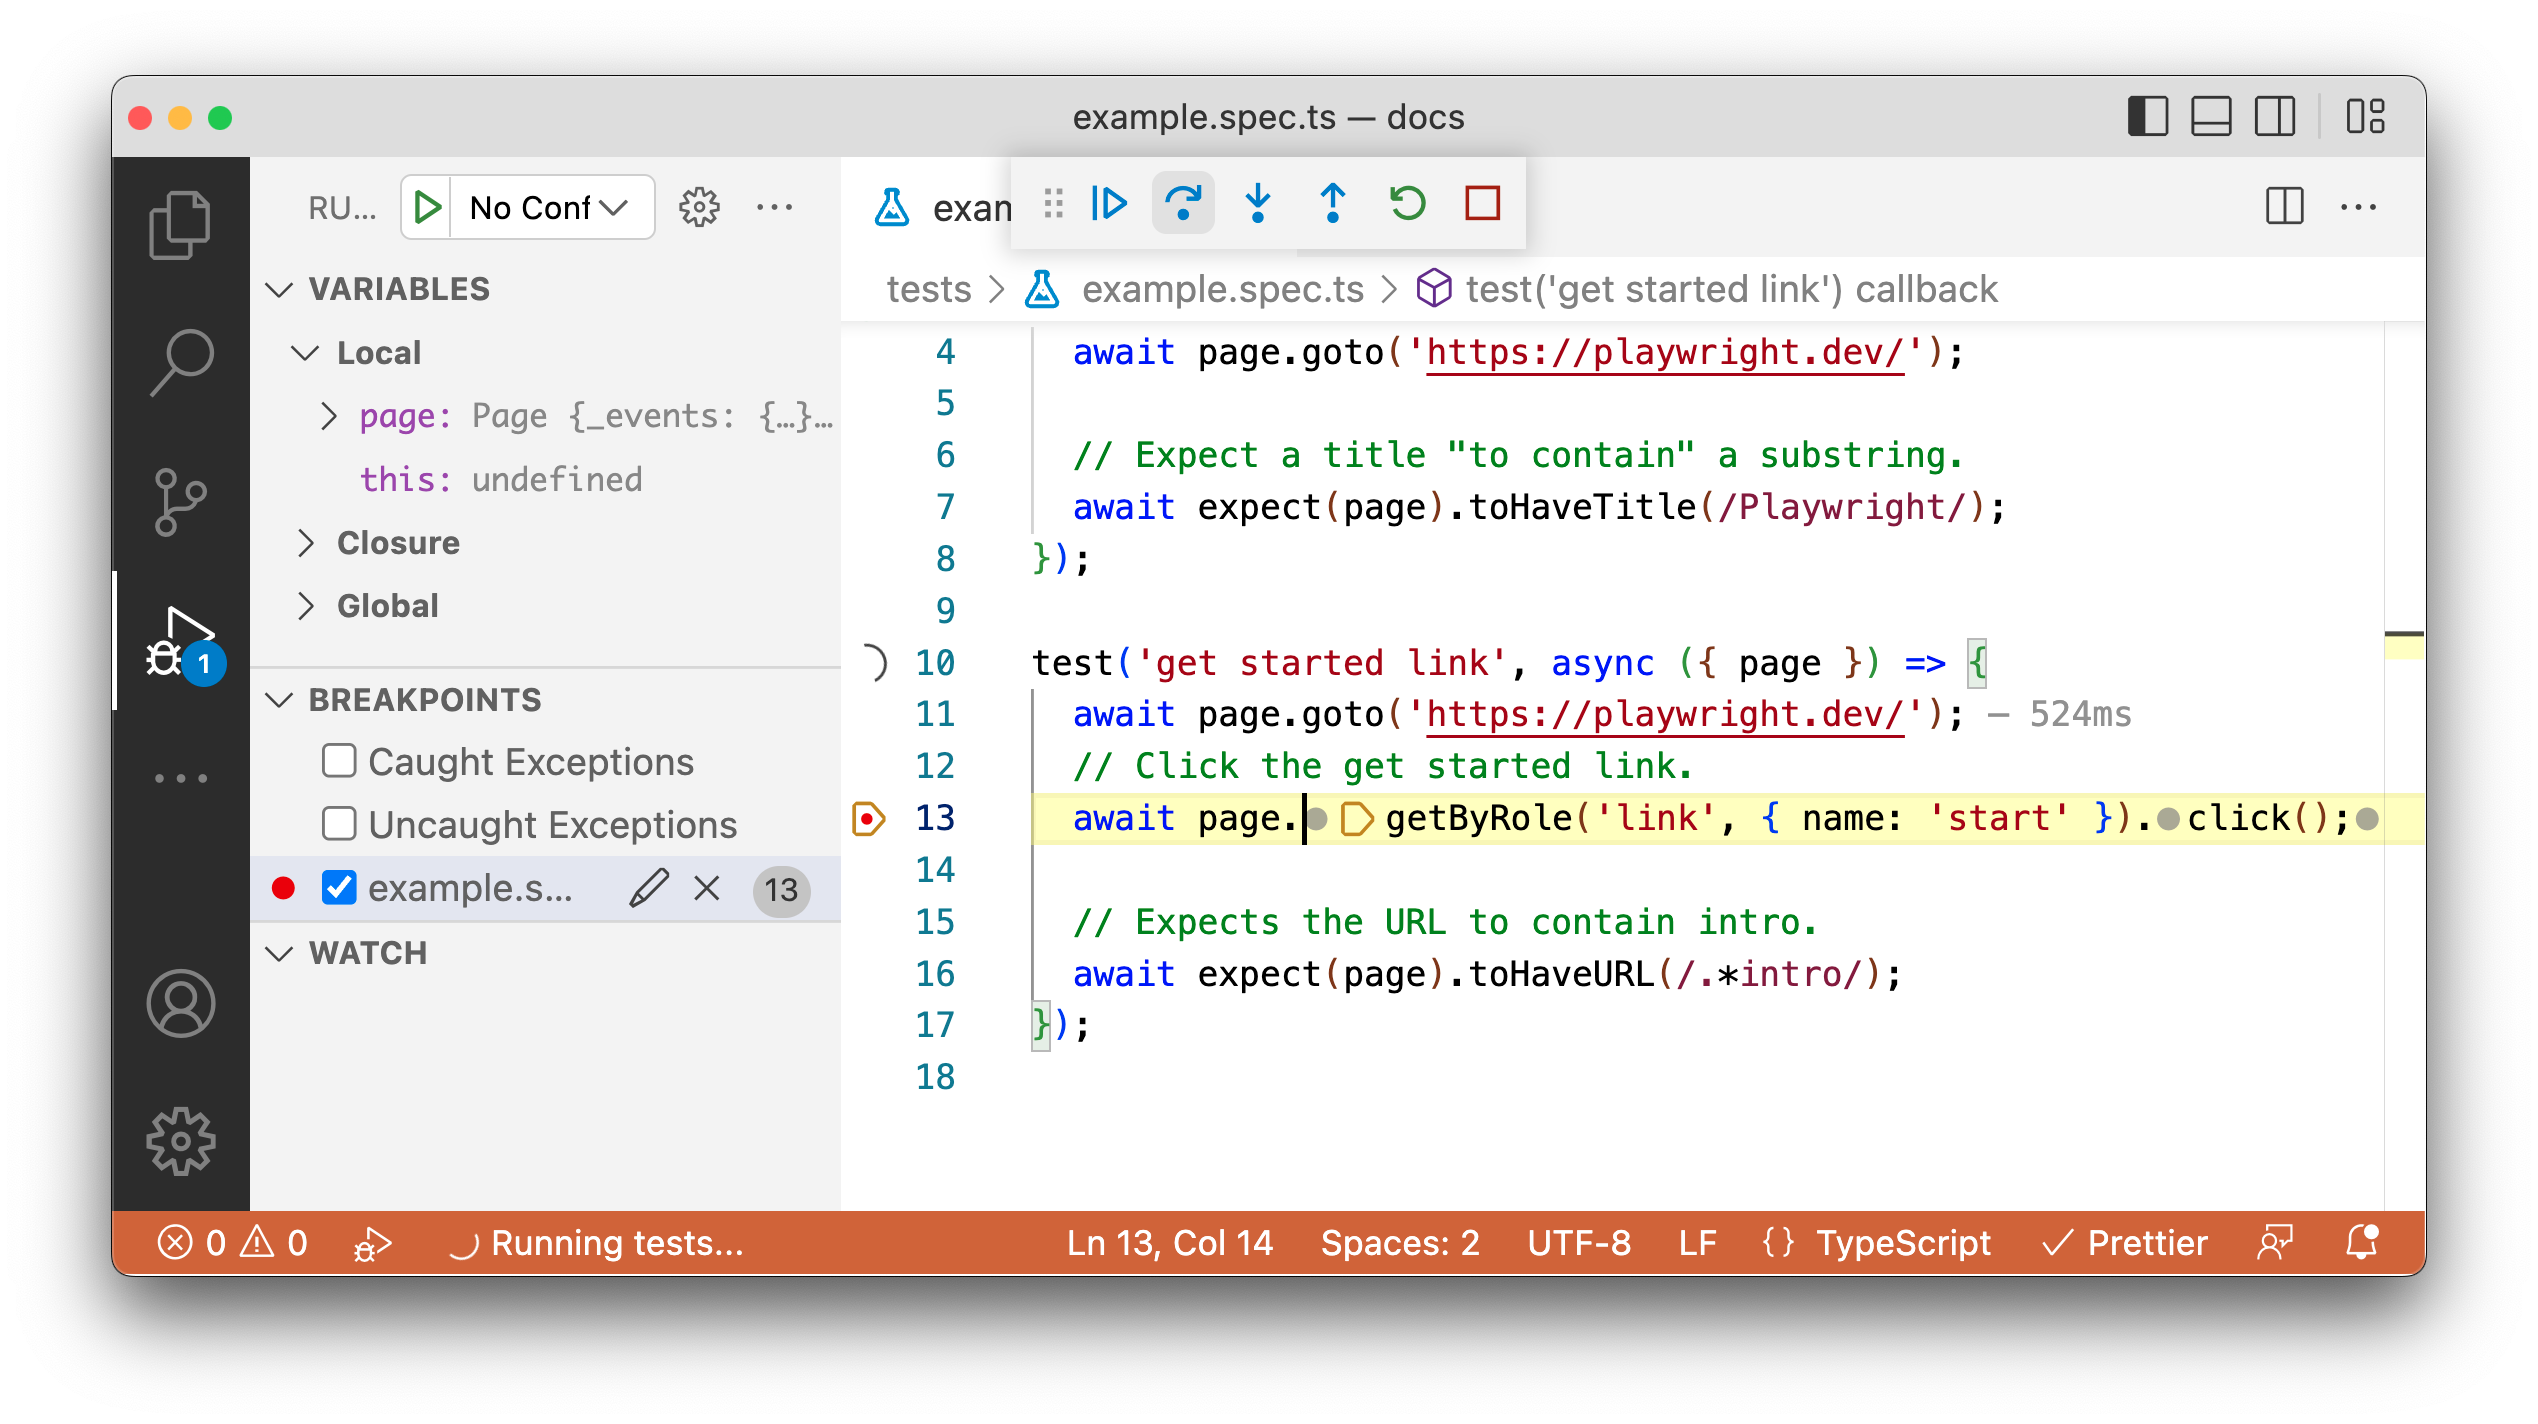
实时调试
🌐 Live Debugging
你可以在 VS Code 中实时调试你的测试。在勾选 Show Browser 选项后运行测试,点击 VS Code 中的任意定位器,它将在浏览器窗口中被高亮显示。Playwright 还会告诉你是否有多个匹配项。
🌐 You can debug your test live in VS Code. After running a test with the Show Browser option checked, click on any of the locators in VS Code and it will be highlighted in the Browser window. Playwright will also show you if there are multiple matches.
你还可以在 VS Code 中编辑定位器,Playwright 将在浏览器窗口中实时显示更改。
🌐 You can also edit the locators in VS Code and Playwright will show you the changes live in the browser window.
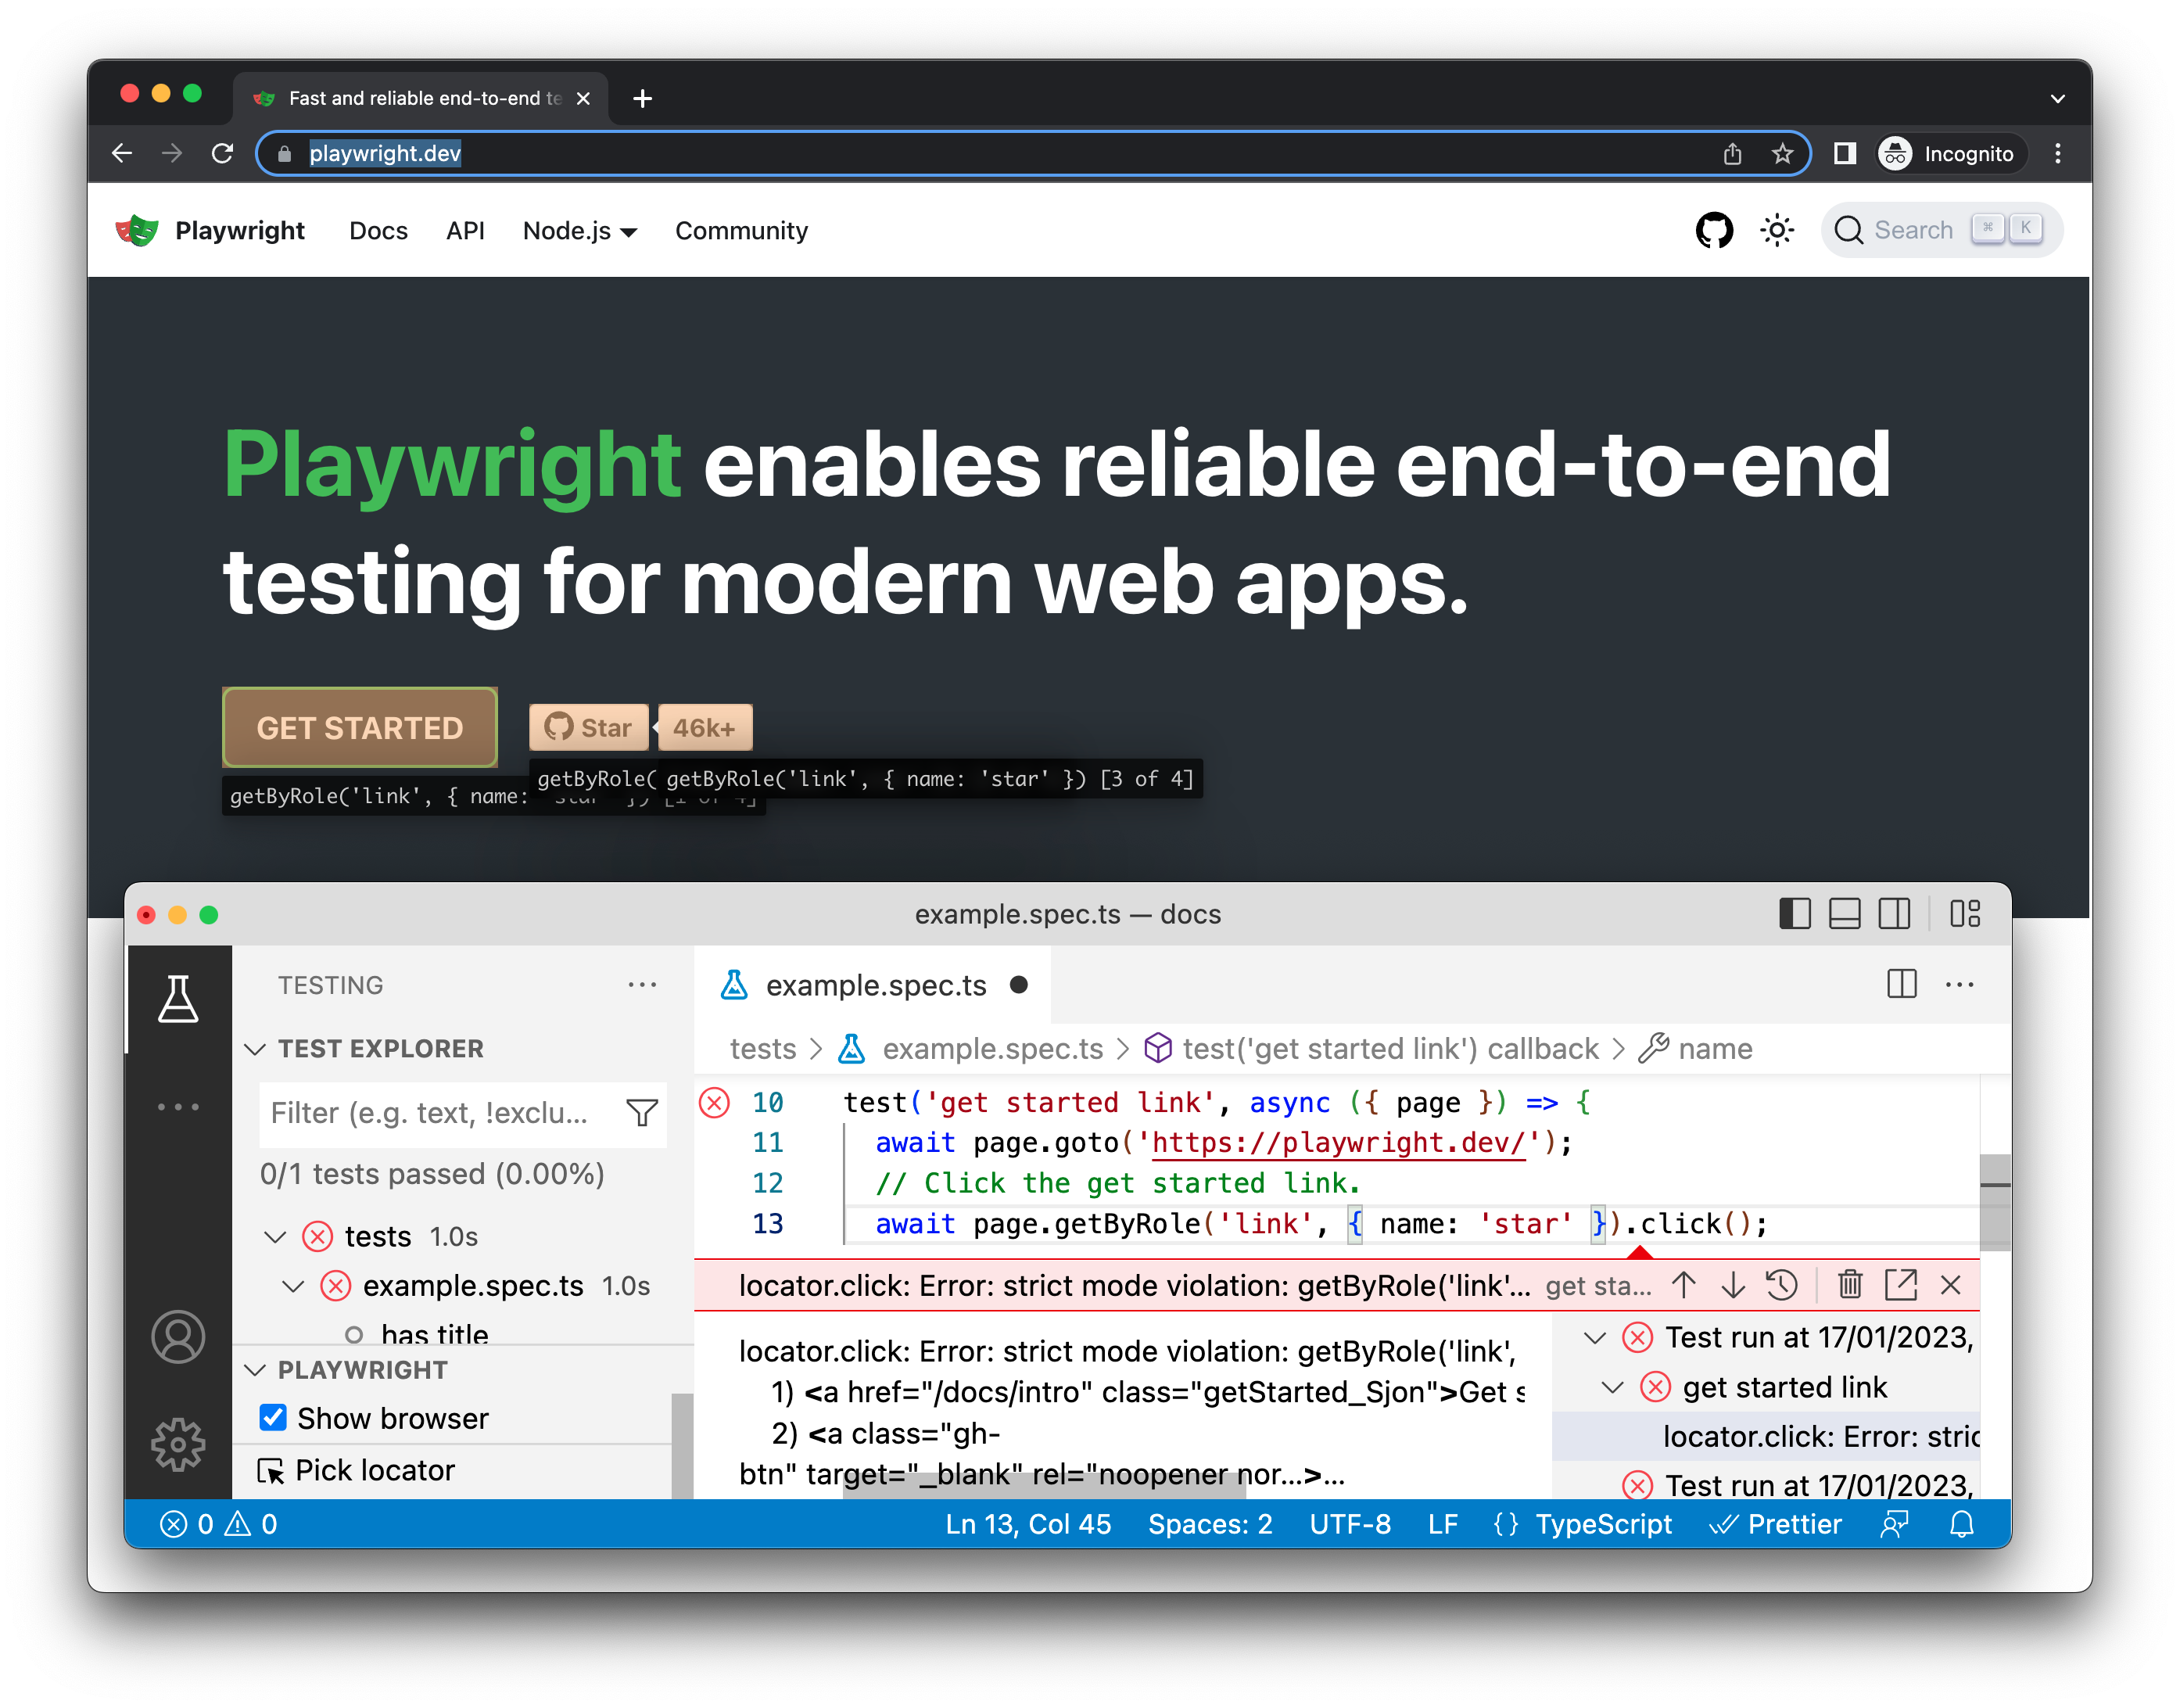
选择定位器
🌐 Picking a Locator
选择一个定位器,然后通过点击测试侧边栏的 Pick locator 按钮将其复制到你的测试文件中。然后在浏览器中点击你需要的元素,它现在会显示在 VS Code 的 Pick locator 框中。按键盘上的 'enter' 将定位器复制到剪贴板中,然后粘贴到你的代码中的任何位置。或者如果你想取消,按 'escape'。
🌐 Pick a locator and copy it into your test file by clicking the Pick locator button from the testing sidebar. Then in the browser click the element you require and it will now show up in the Pick locator box in VS Code. Press 'enter' on your keyboard to copy the locator into the clipboard and then paste anywhere in your code. Or press 'escape' if you want to cancel.
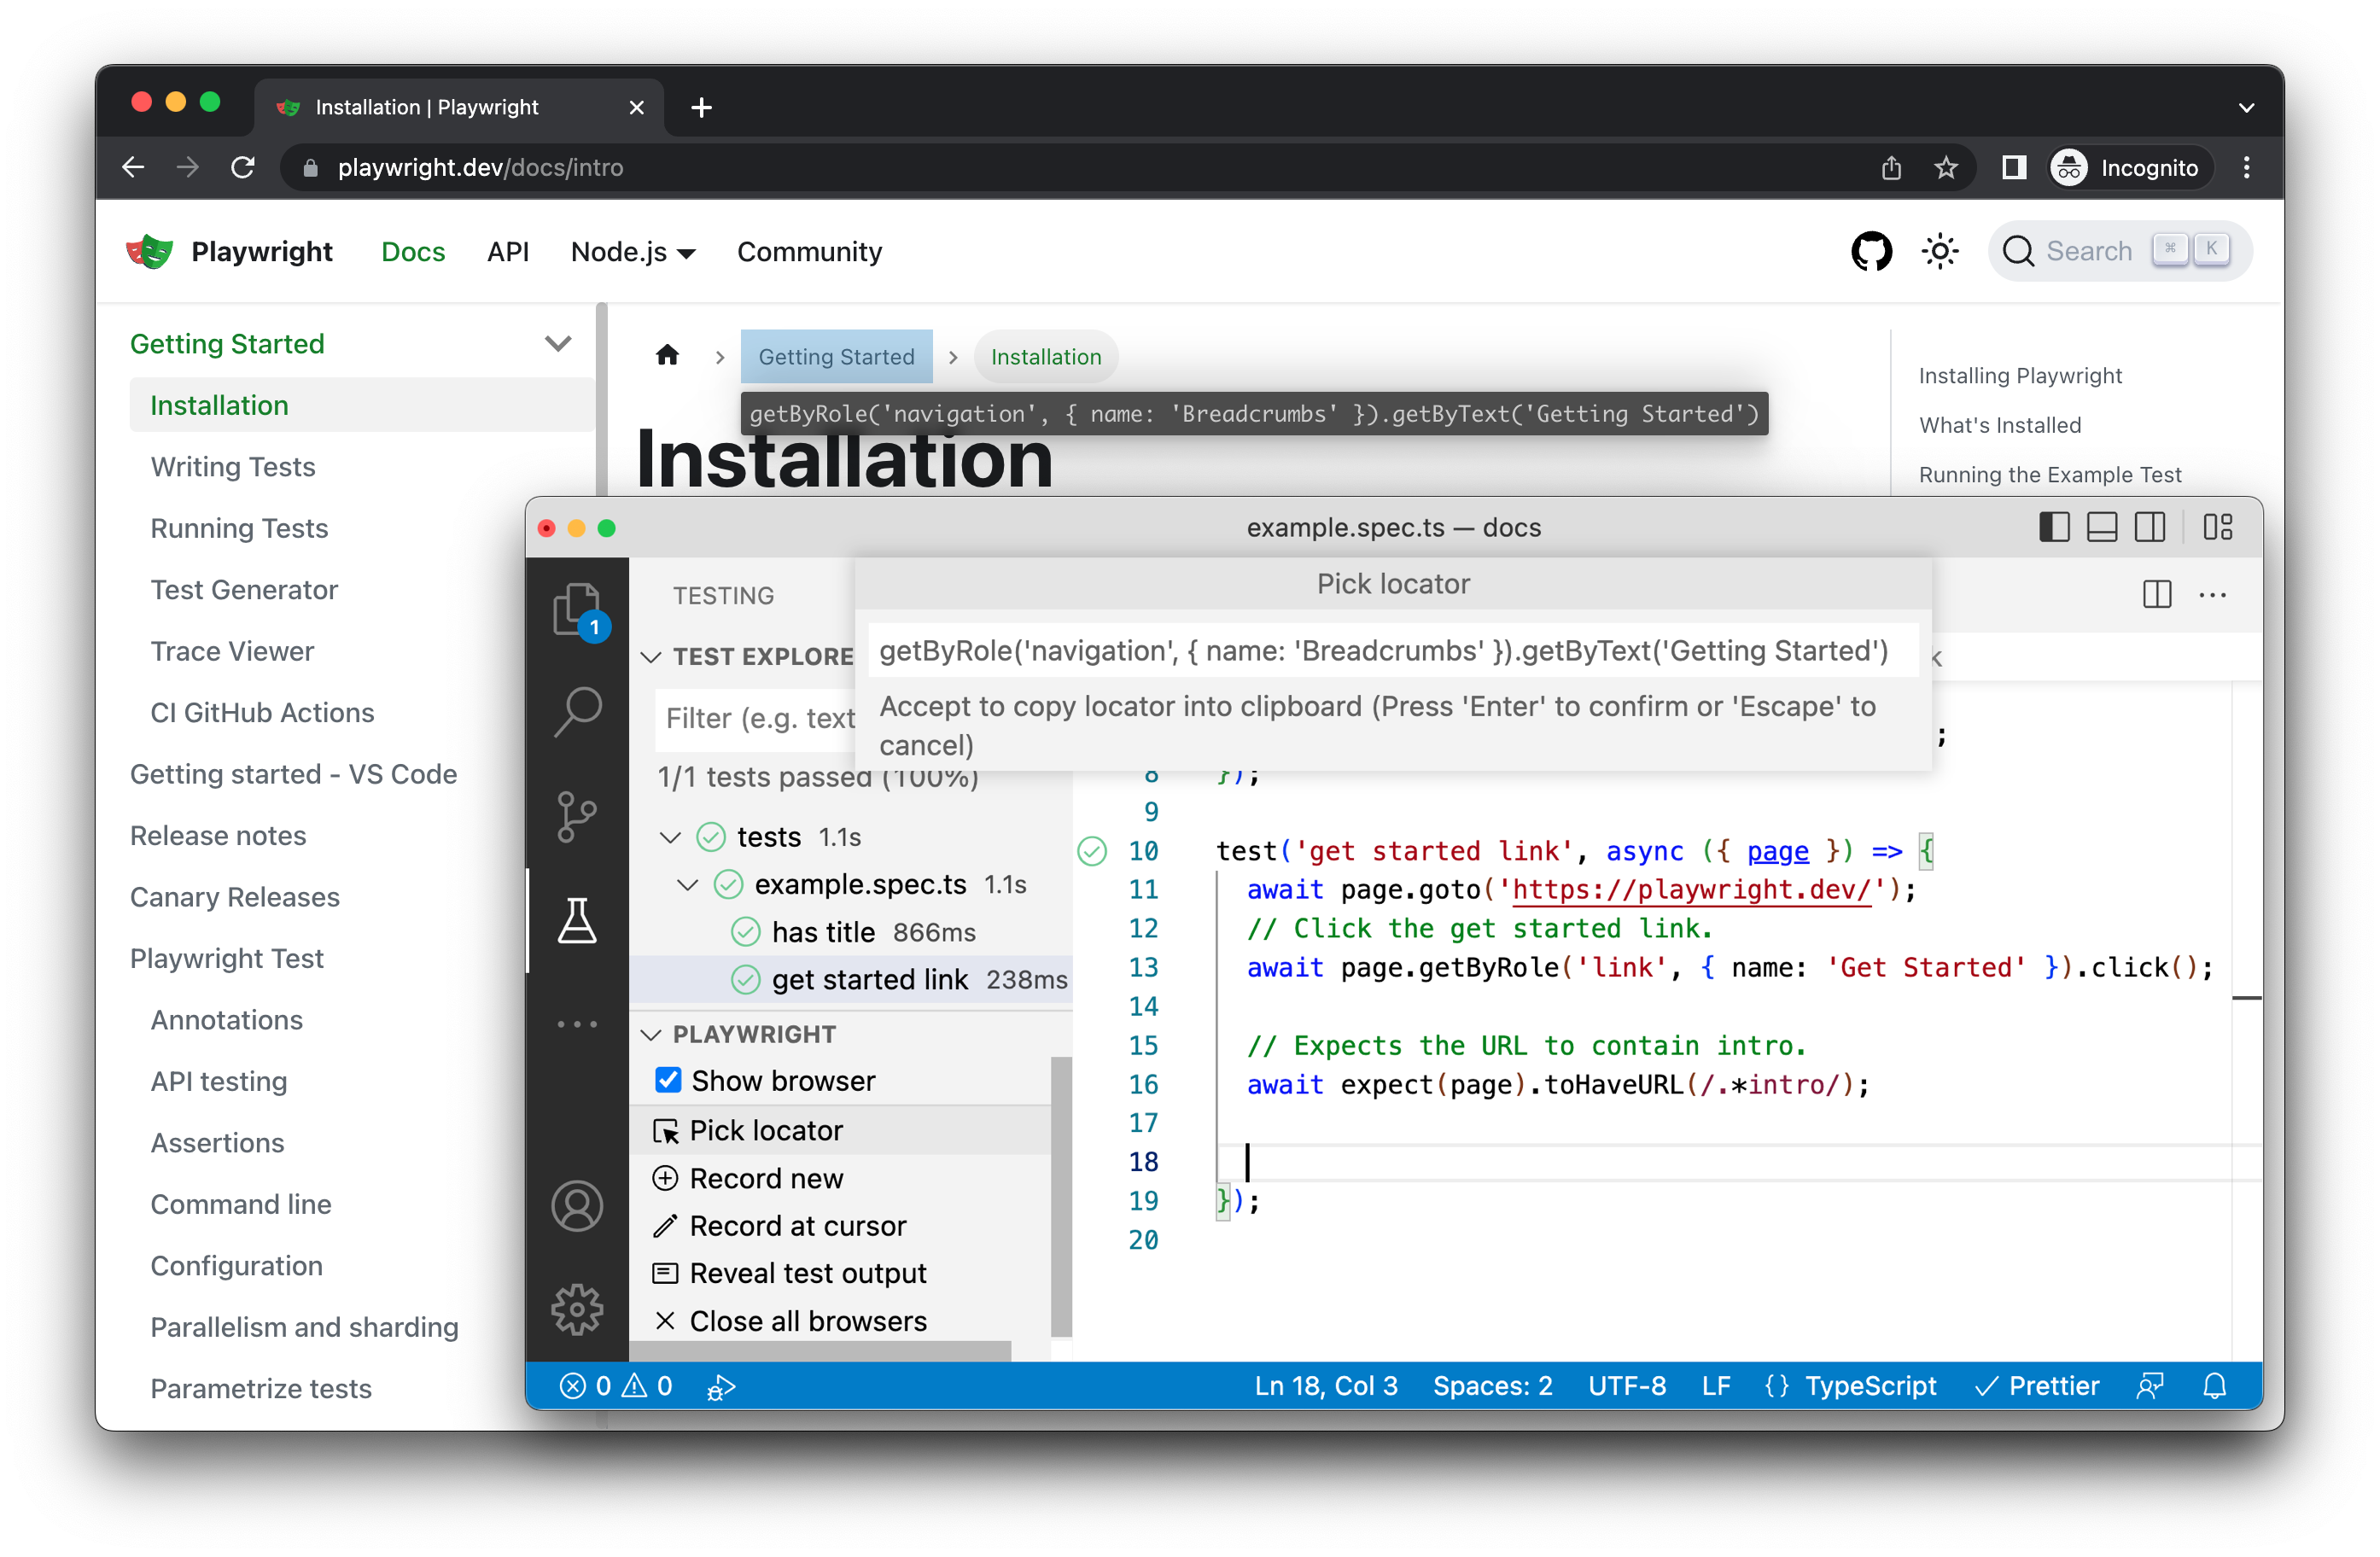
Playwright 会查看你的页面并找出最佳定位器,优先考虑 role、text 和 test id 定位器。如果 Playwright 发现有多个元素匹配该定位器,它会改进定位器,使其具有弹性并能唯一识别目标元素,这样你就不必担心测试因定位器失败而出错。
🌐 Playwright will look at your page and figure out the best locator, prioritizing role, text and test id locators. If Playwright finds multiple elements matching the locator, it will improve the locator to make it resilient and uniquely identify the target element, so you don't have to worry about failing tests due to locators.
在调试模式下运行
🌐 Run in Debug Mode
要设置断点,请点击你希望设置断点的行号旁边,直到出现红点。通过右键点击你想运行的测试旁边的行,以调试模式运行测试。
🌐 To set a breakpoint click next to the line number where you want the breakpoint to be until a red dot appears. Run the tests in debug mode by right clicking on the line next to the test you want to run.
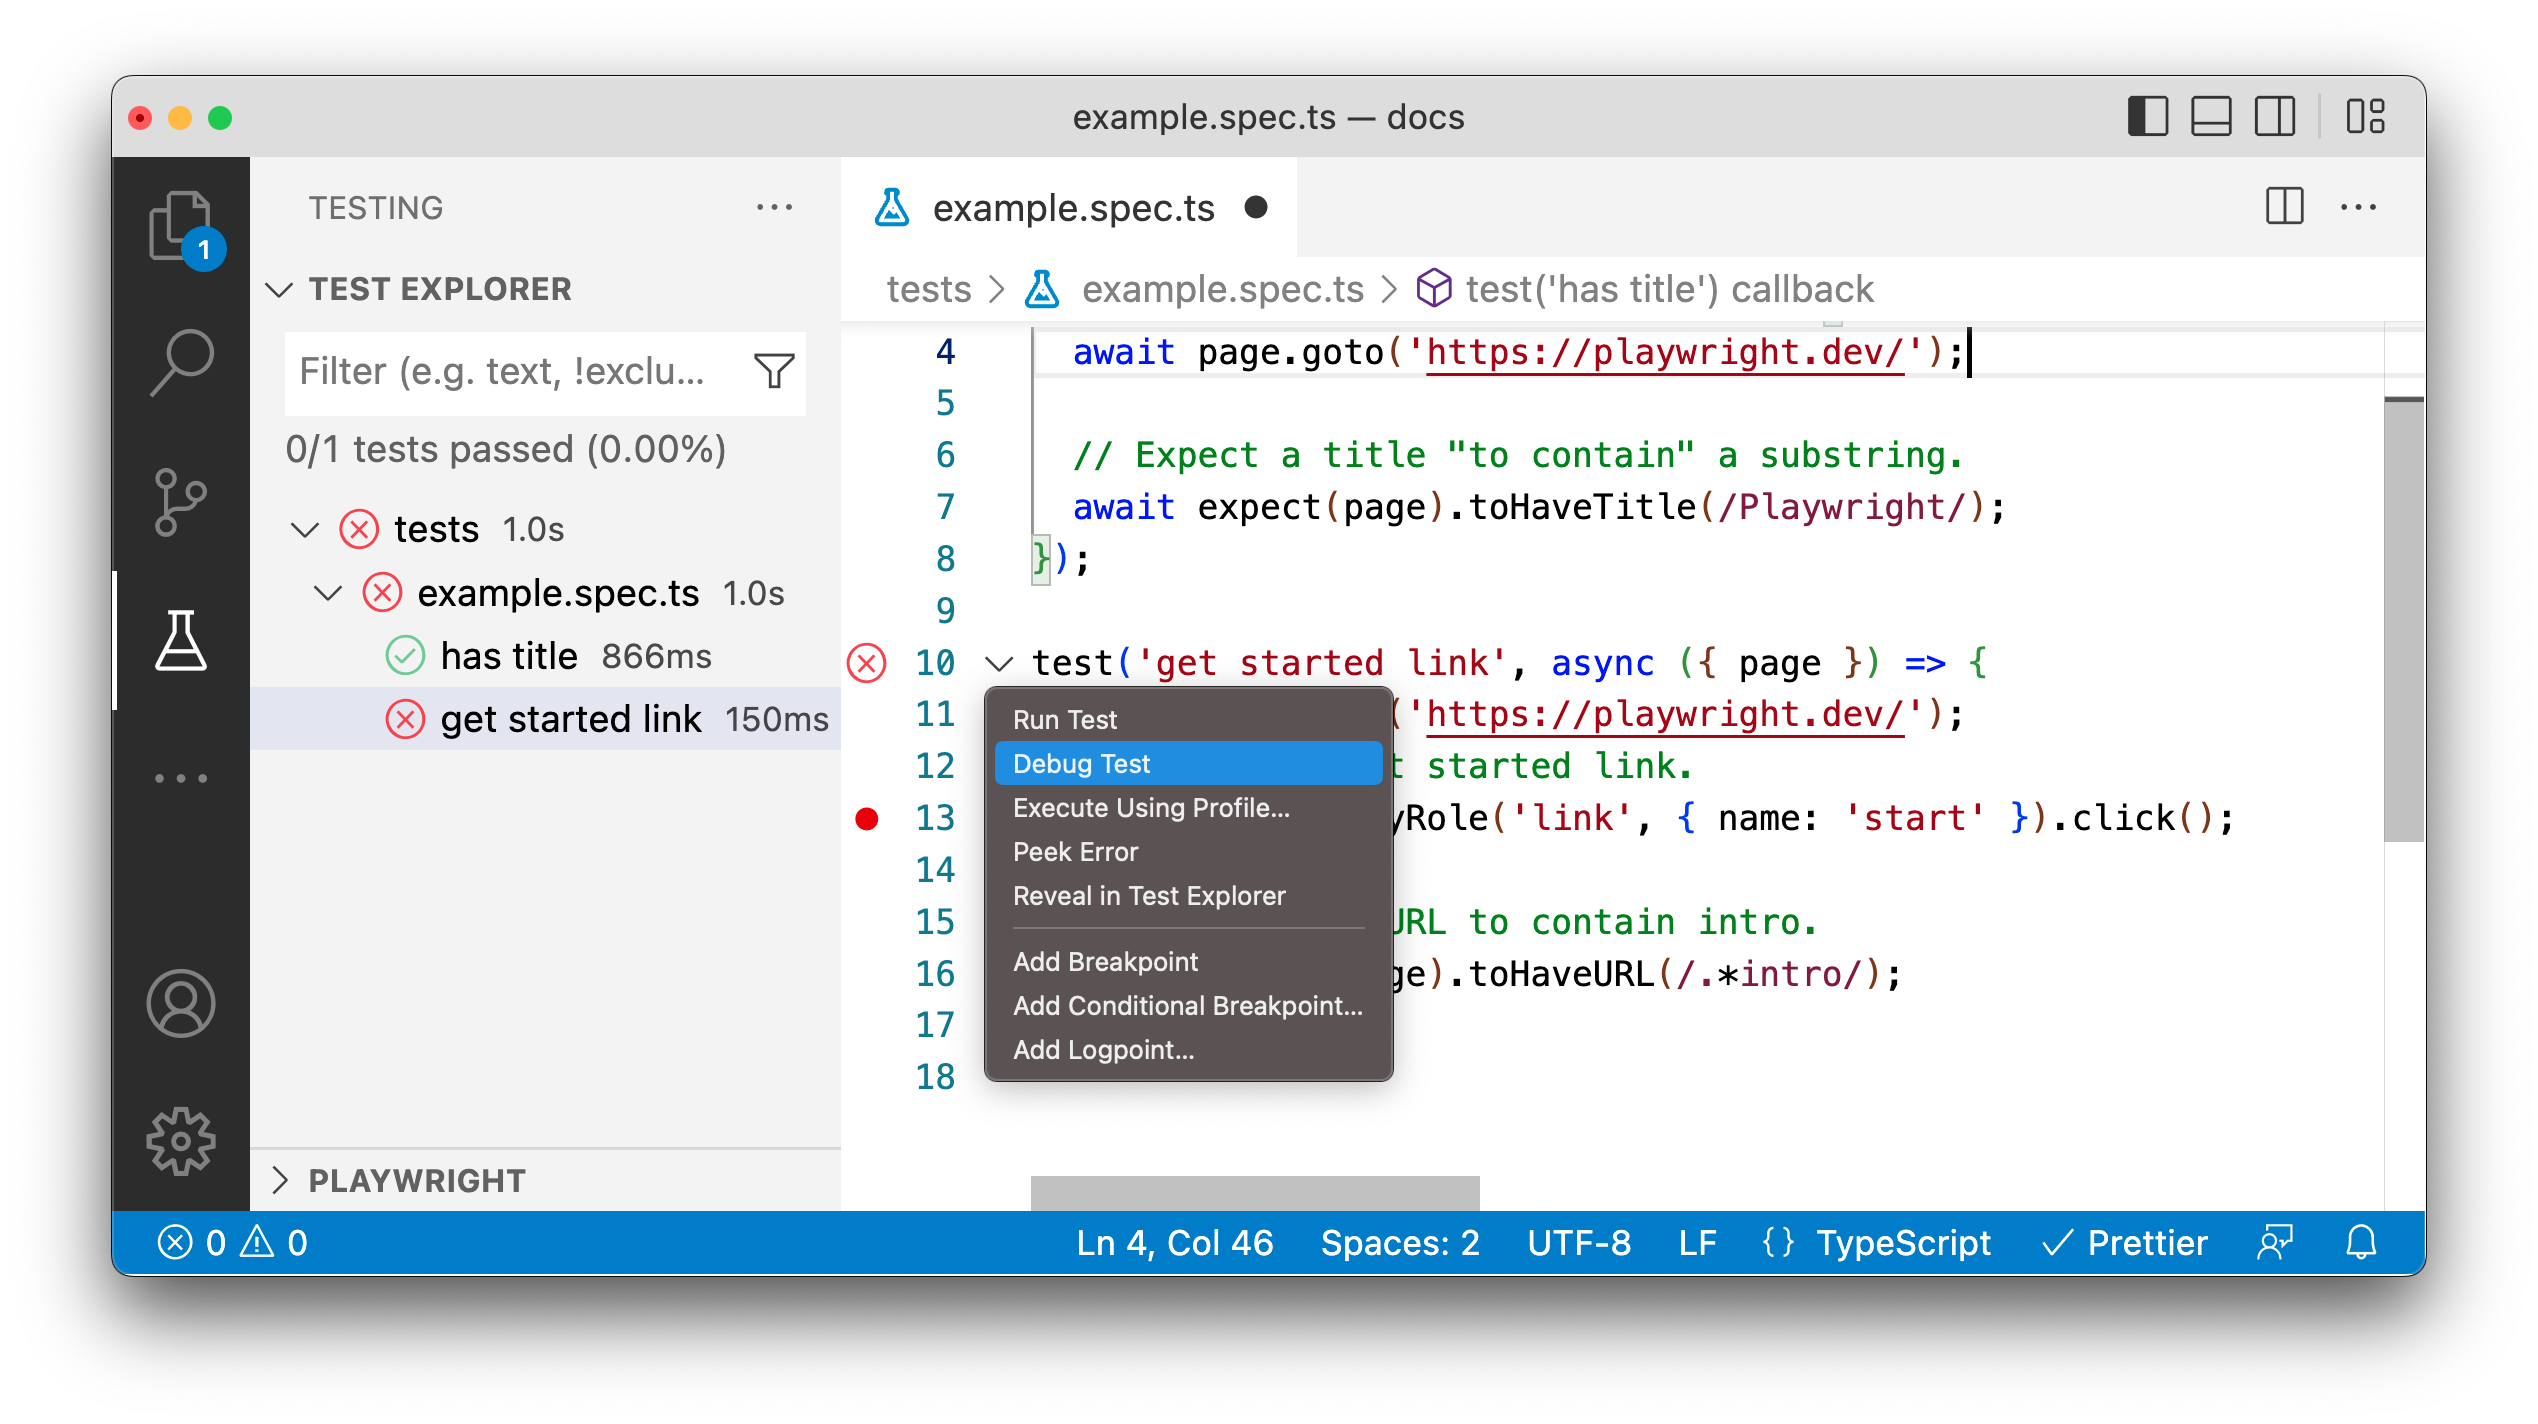
浏览器窗口将会打开,测试会运行并在断点处暂停。你可以逐步执行测试、暂停测试,并从 VS Code 菜单中重新运行测试。
🌐 A browser window will open and the test will run and pause at where the breakpoint is set. You can step through the tests, pause the test and rerun the tests from the menu in VS Code.
使用 Chrome DevTools 调试测试
🌐 Debug Tests Using Chrome DevTools
在 VS Code 中不要使用 Debug Test,请选择 Run Test。启用 Show Browser 后,浏览器会话将被重用,使你可以打开 Chrome 开发者工具以持续调试你的测试和 Web 应用。
🌐 Instead of using Debug Test, choose Run Test in VS Code. With Show Browser enabled, the browser session is reused, letting you open Chrome DevTools for continuous debugging of your tests and the web application.
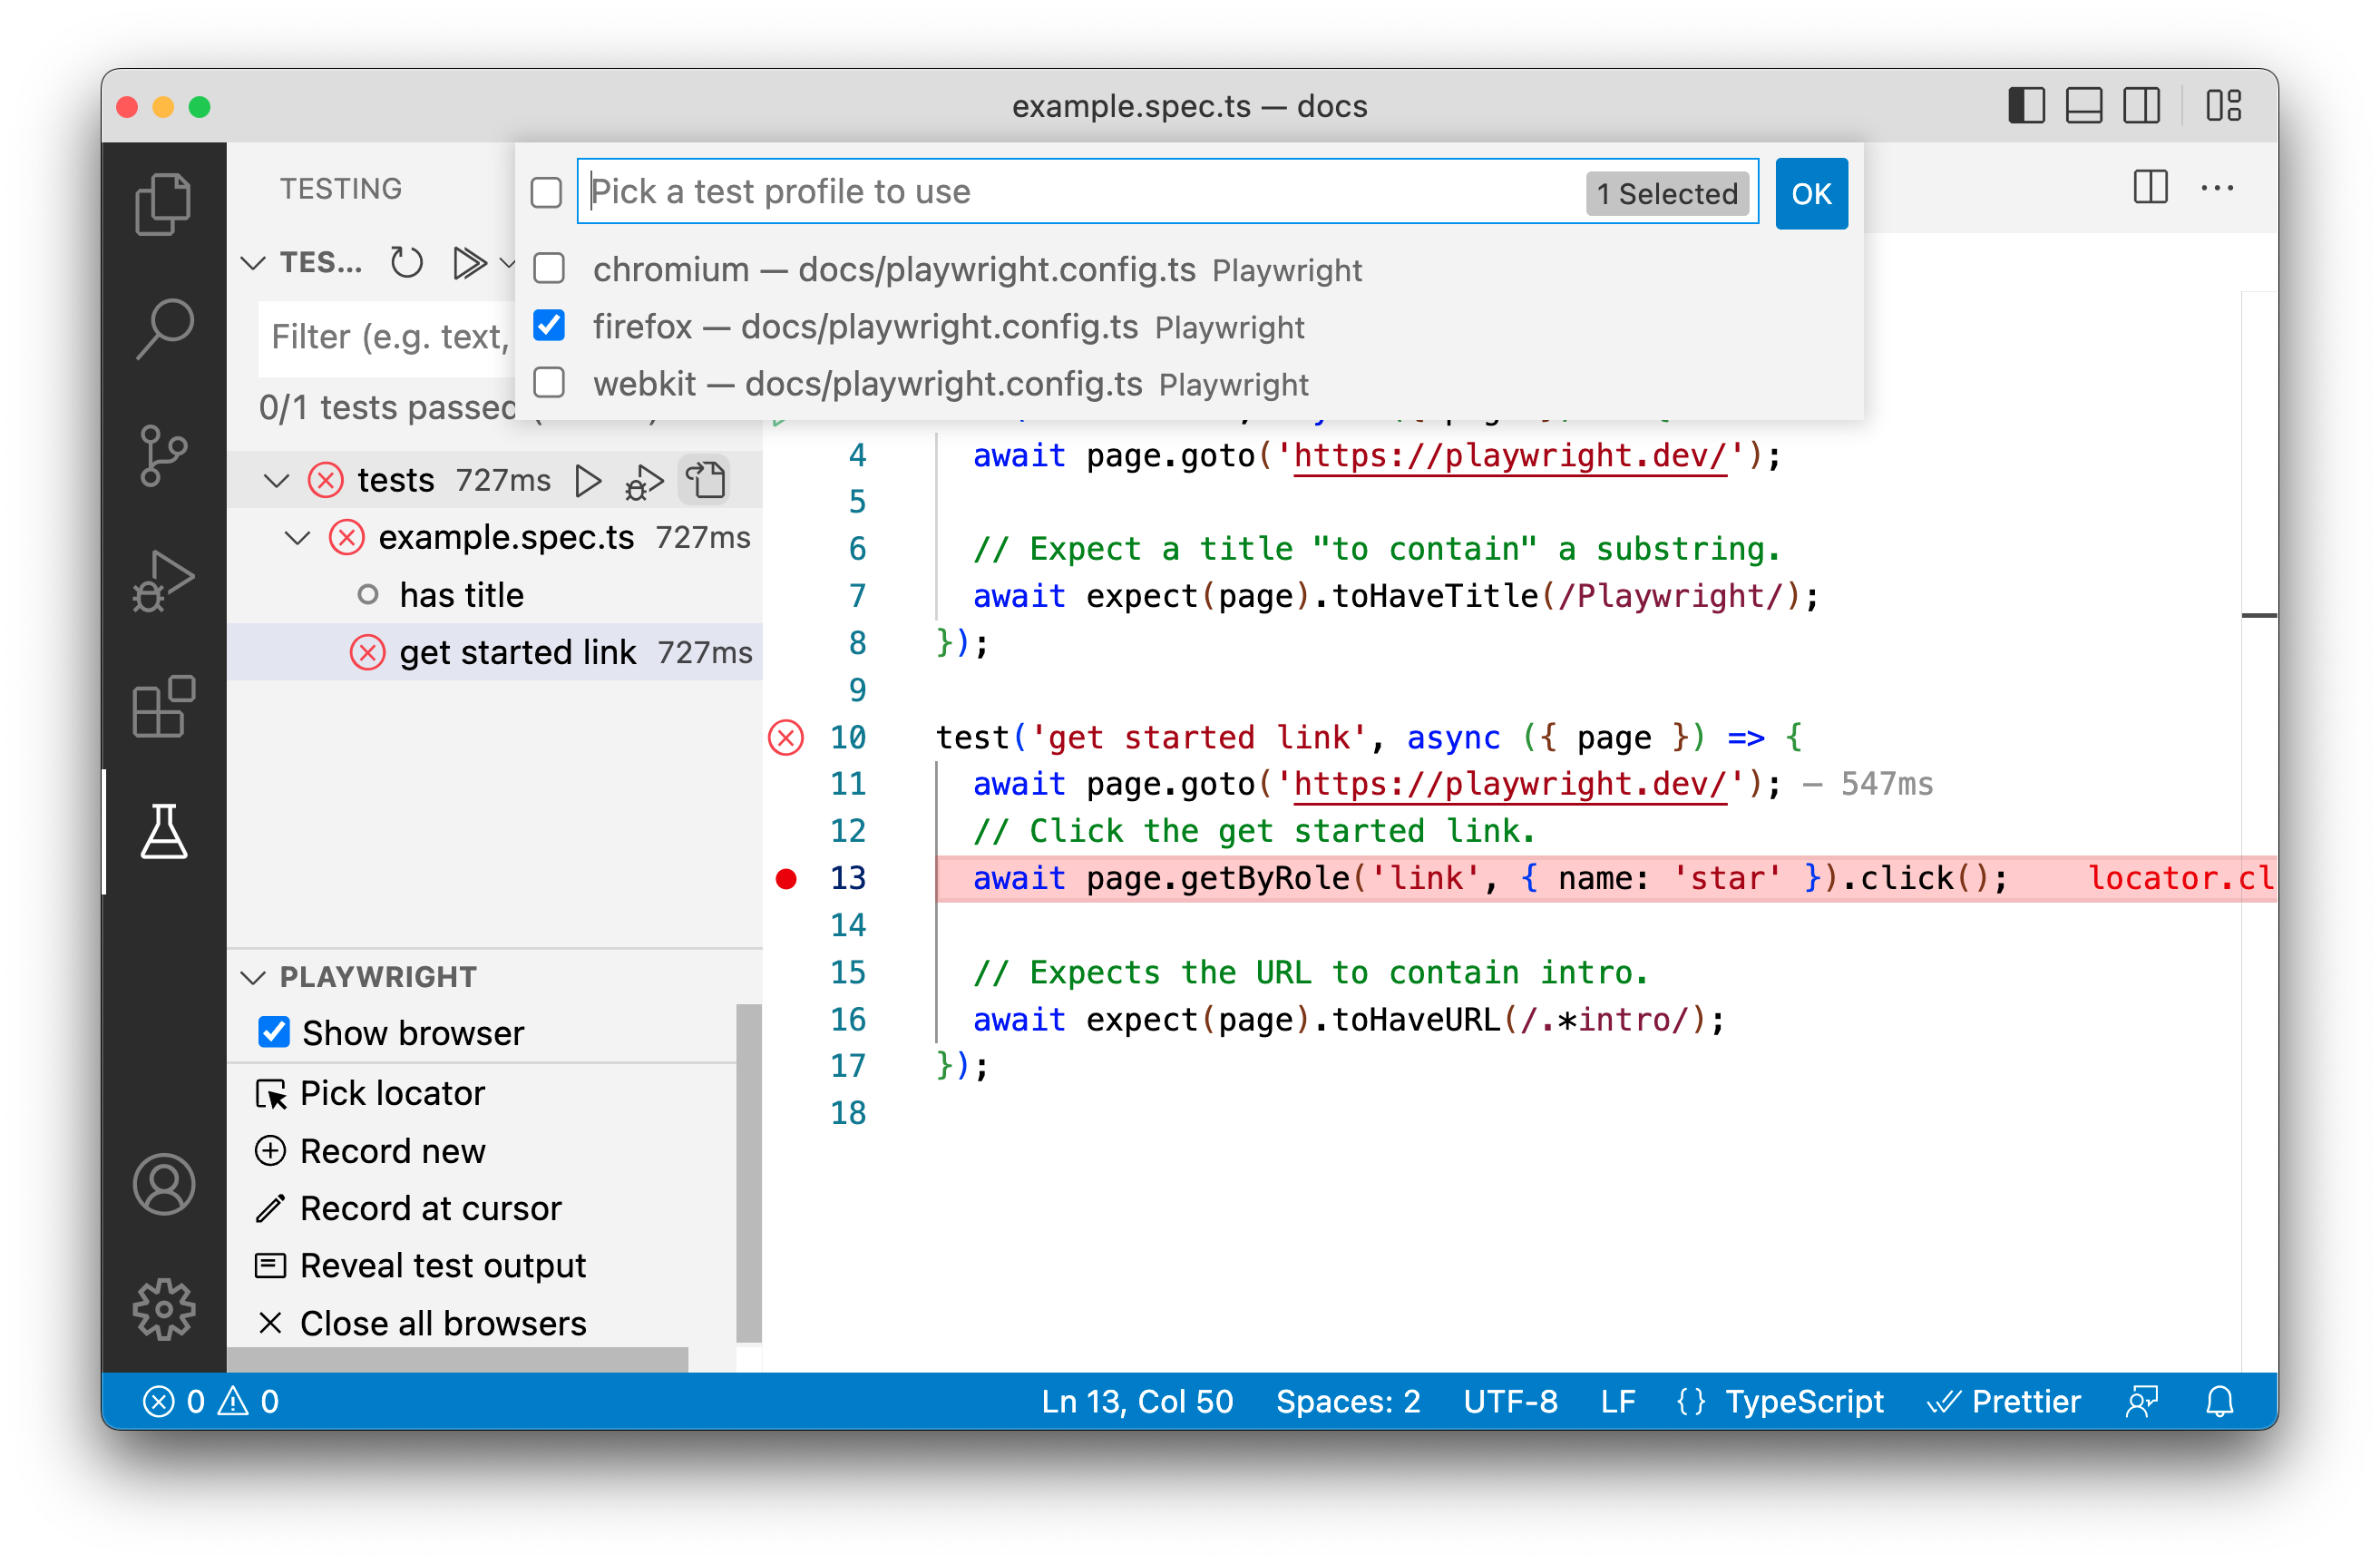
在不同浏览器中调试
🌐 Debug in different Browsers
默认情况下,调试是使用 Chromium 配置文件进行的。你可以通过在测试侧边栏中右键点击调试图标,并从下拉菜单中点击“选择默认配置文件”选项,在不同的浏览器上调试你的测试。
🌐 By default, debugging is done using the Chromium profile. You can debug your tests on different browsers by right clicking on the debug icon in the testing sidebar and clicking on the 'Select Default Profile' option from the dropdown.
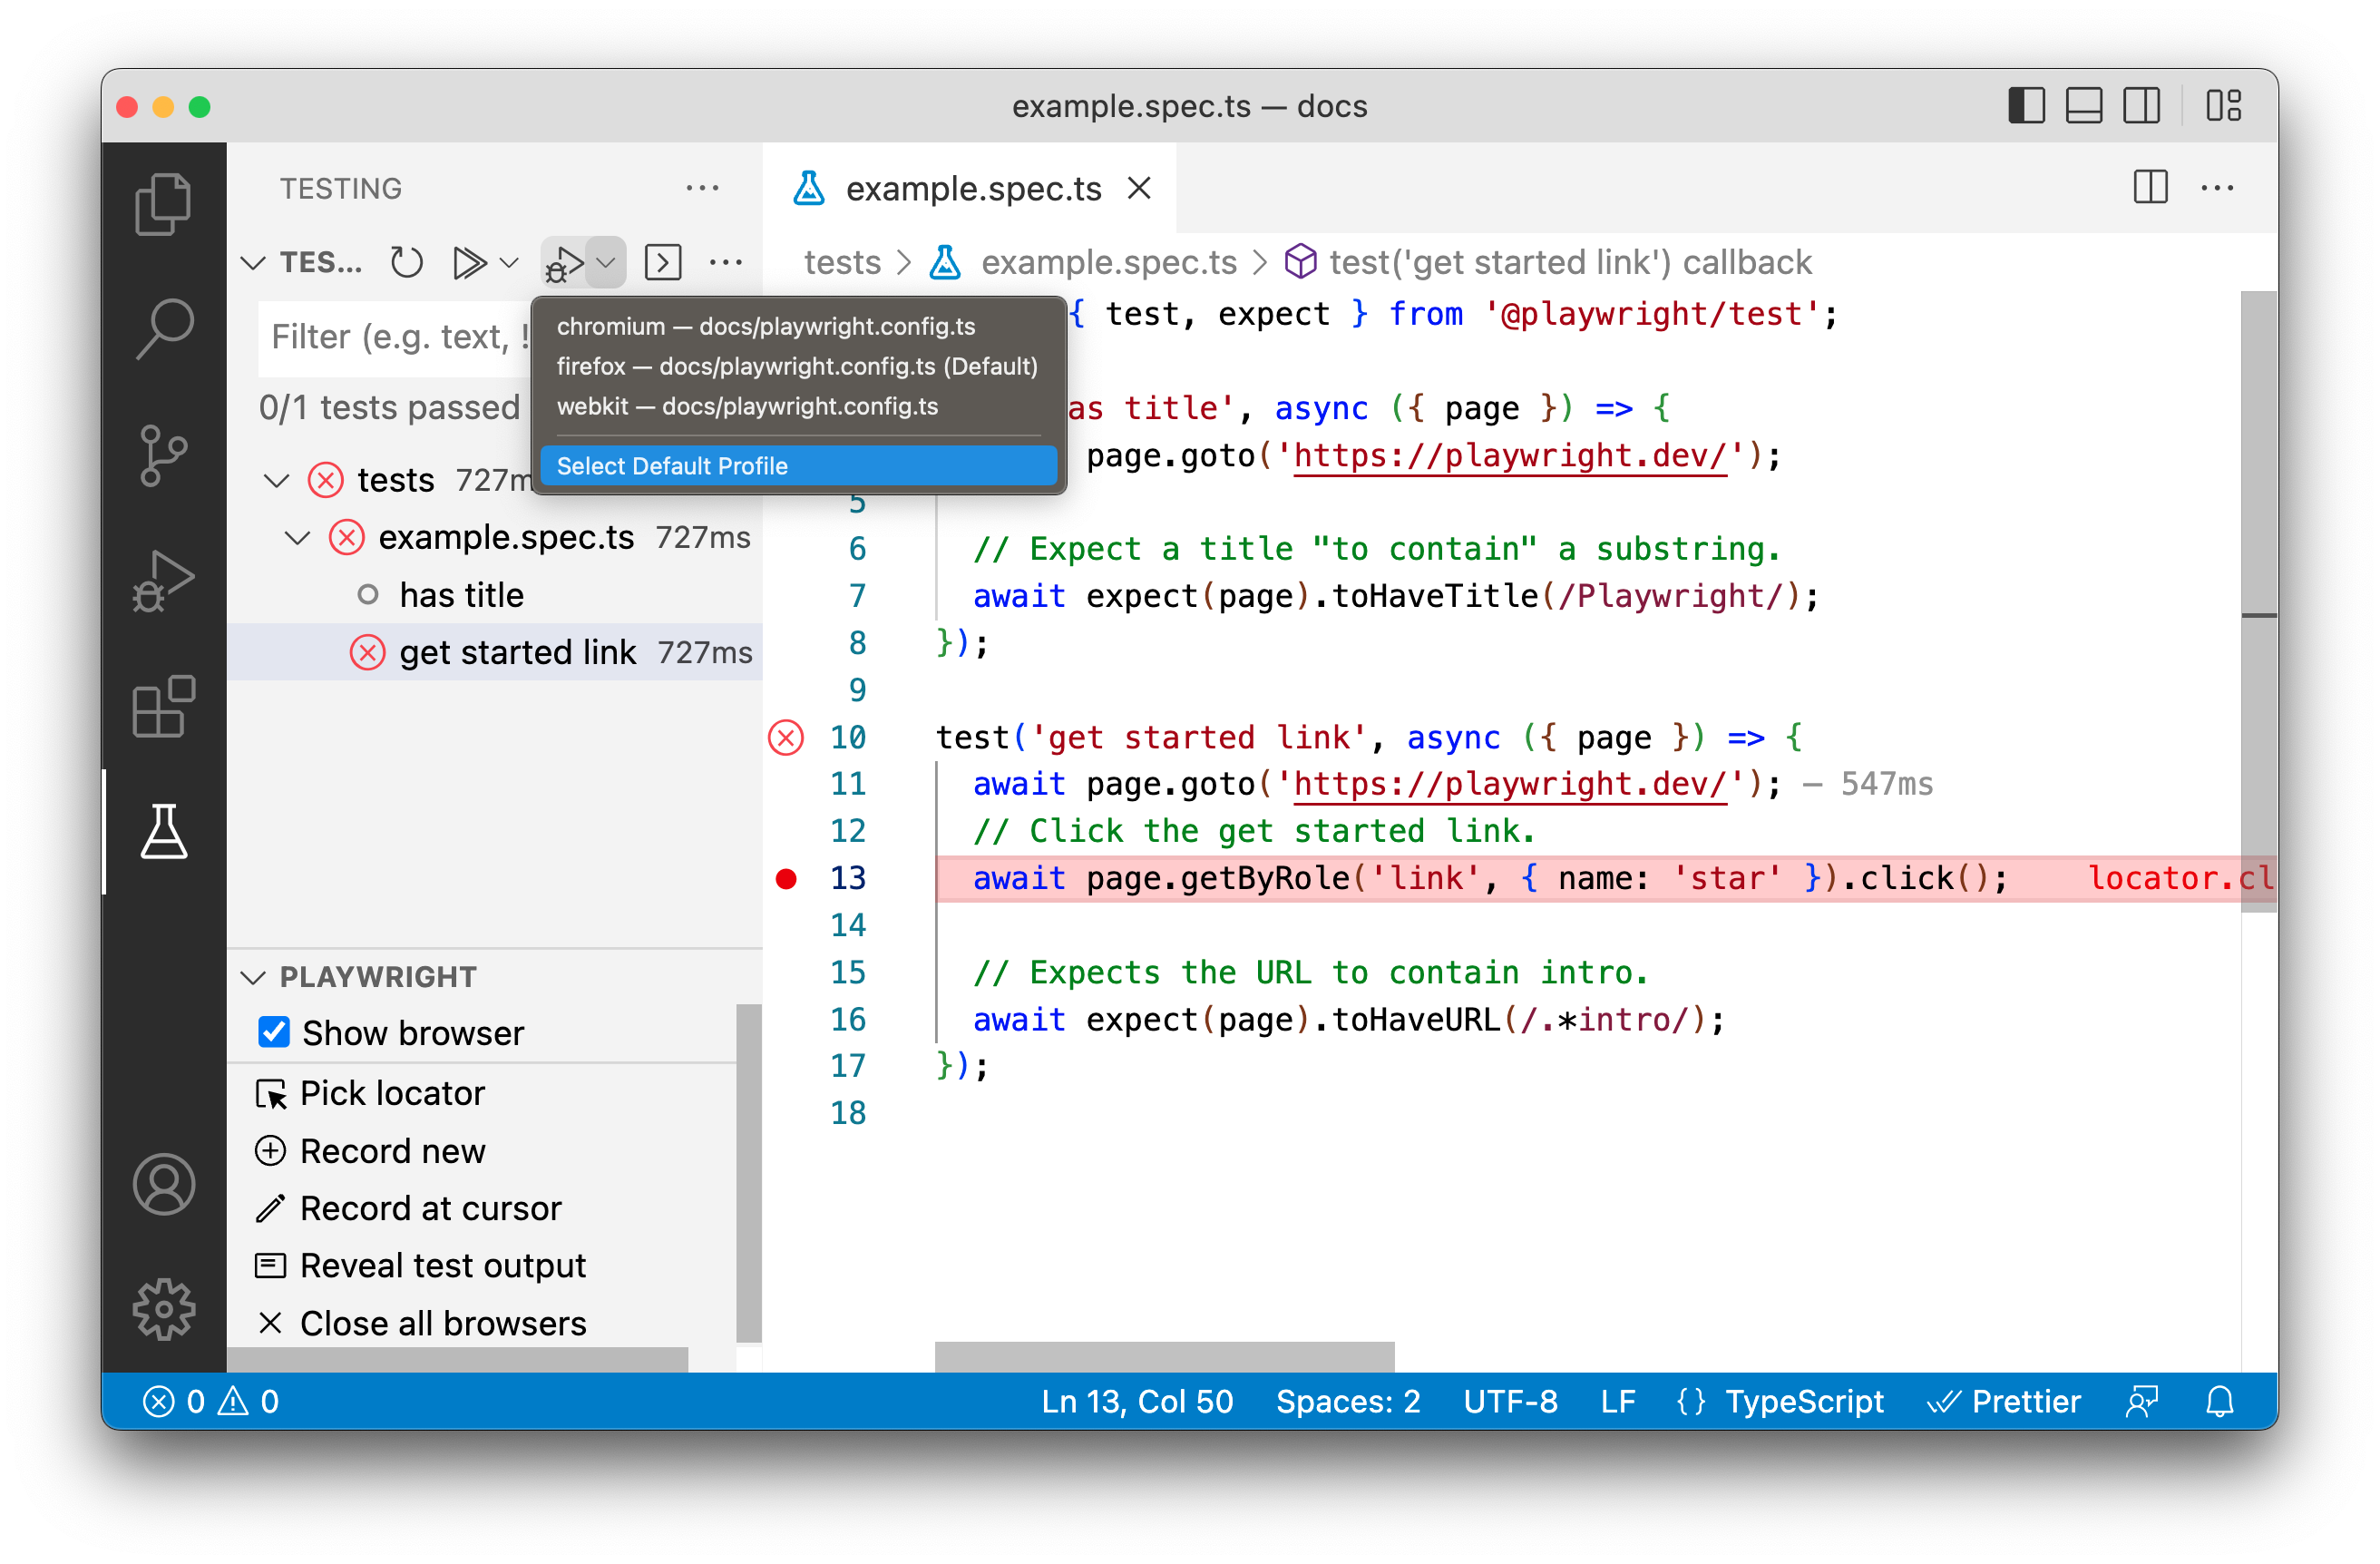
然后选择你希望用于调试测试的测试配置文件。每次以调试模式运行测试时,都会使用你选择的配置文件。你可以通过右键单击测试所在的行号,并从菜单中选择“调试测试”来以调试模式运行测试。
🌐 Then choose the test profile you would like to use for debugging your tests. Each time you run your test in debug mode it will use the profile you selected. You can run tests in debug mode by right clicking the line number where your test is and selecting 'Debug Test' from the menu.
要了解有关调试的更多信息,请参阅 在 Visual Studio Code 中调试。
🌐 To learn more about debugging, see Debugging in Visual Studio Code.
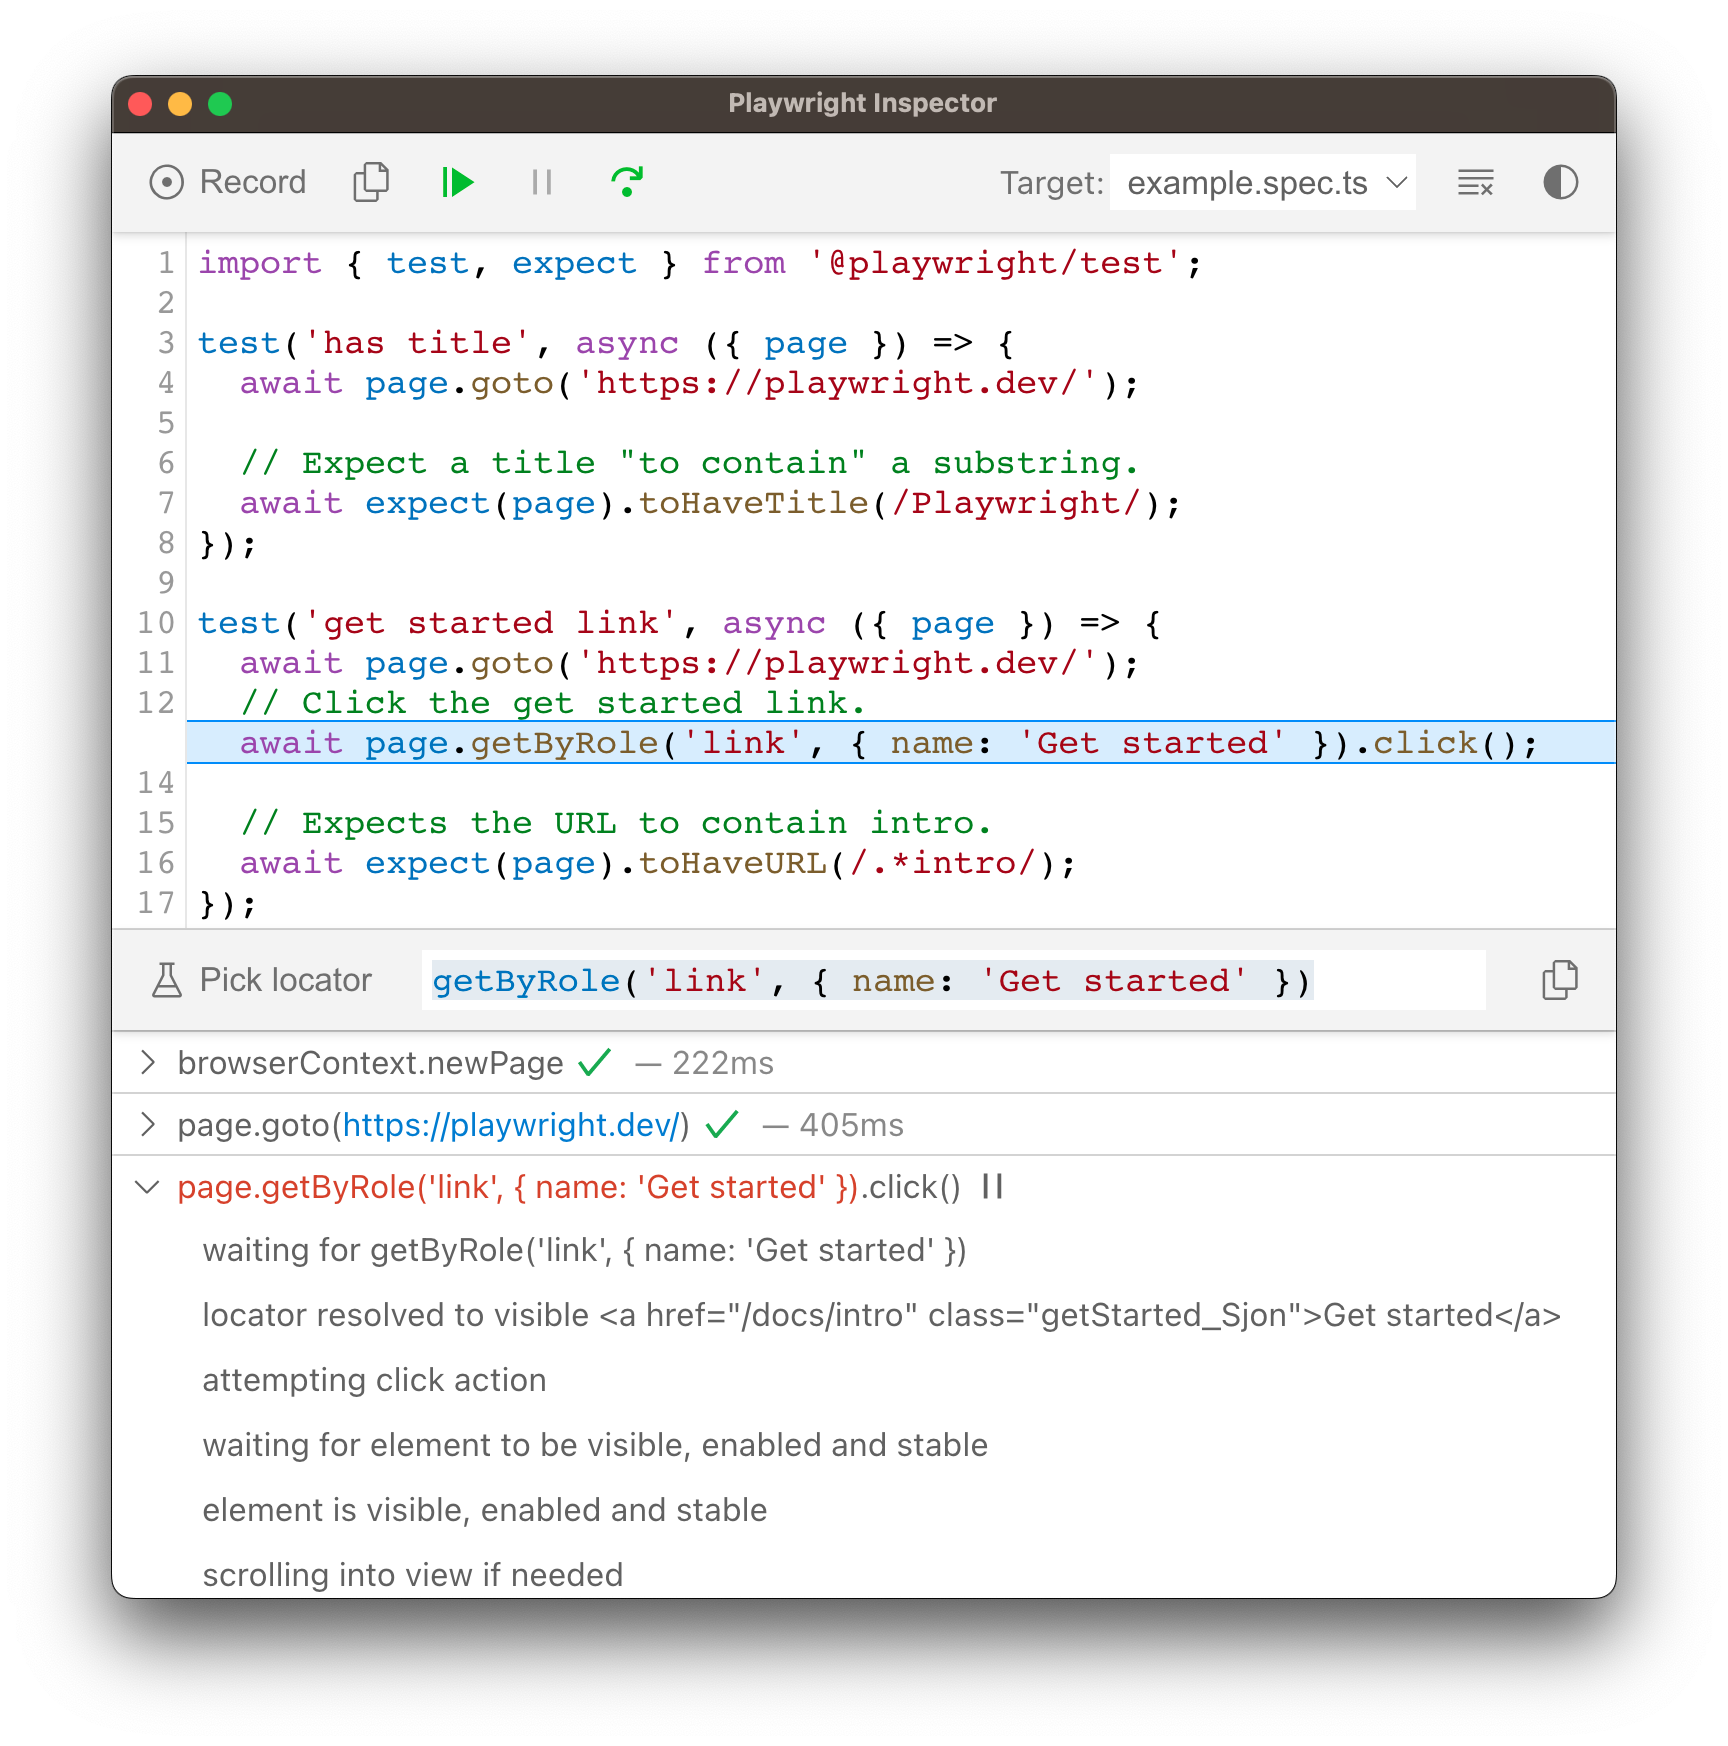
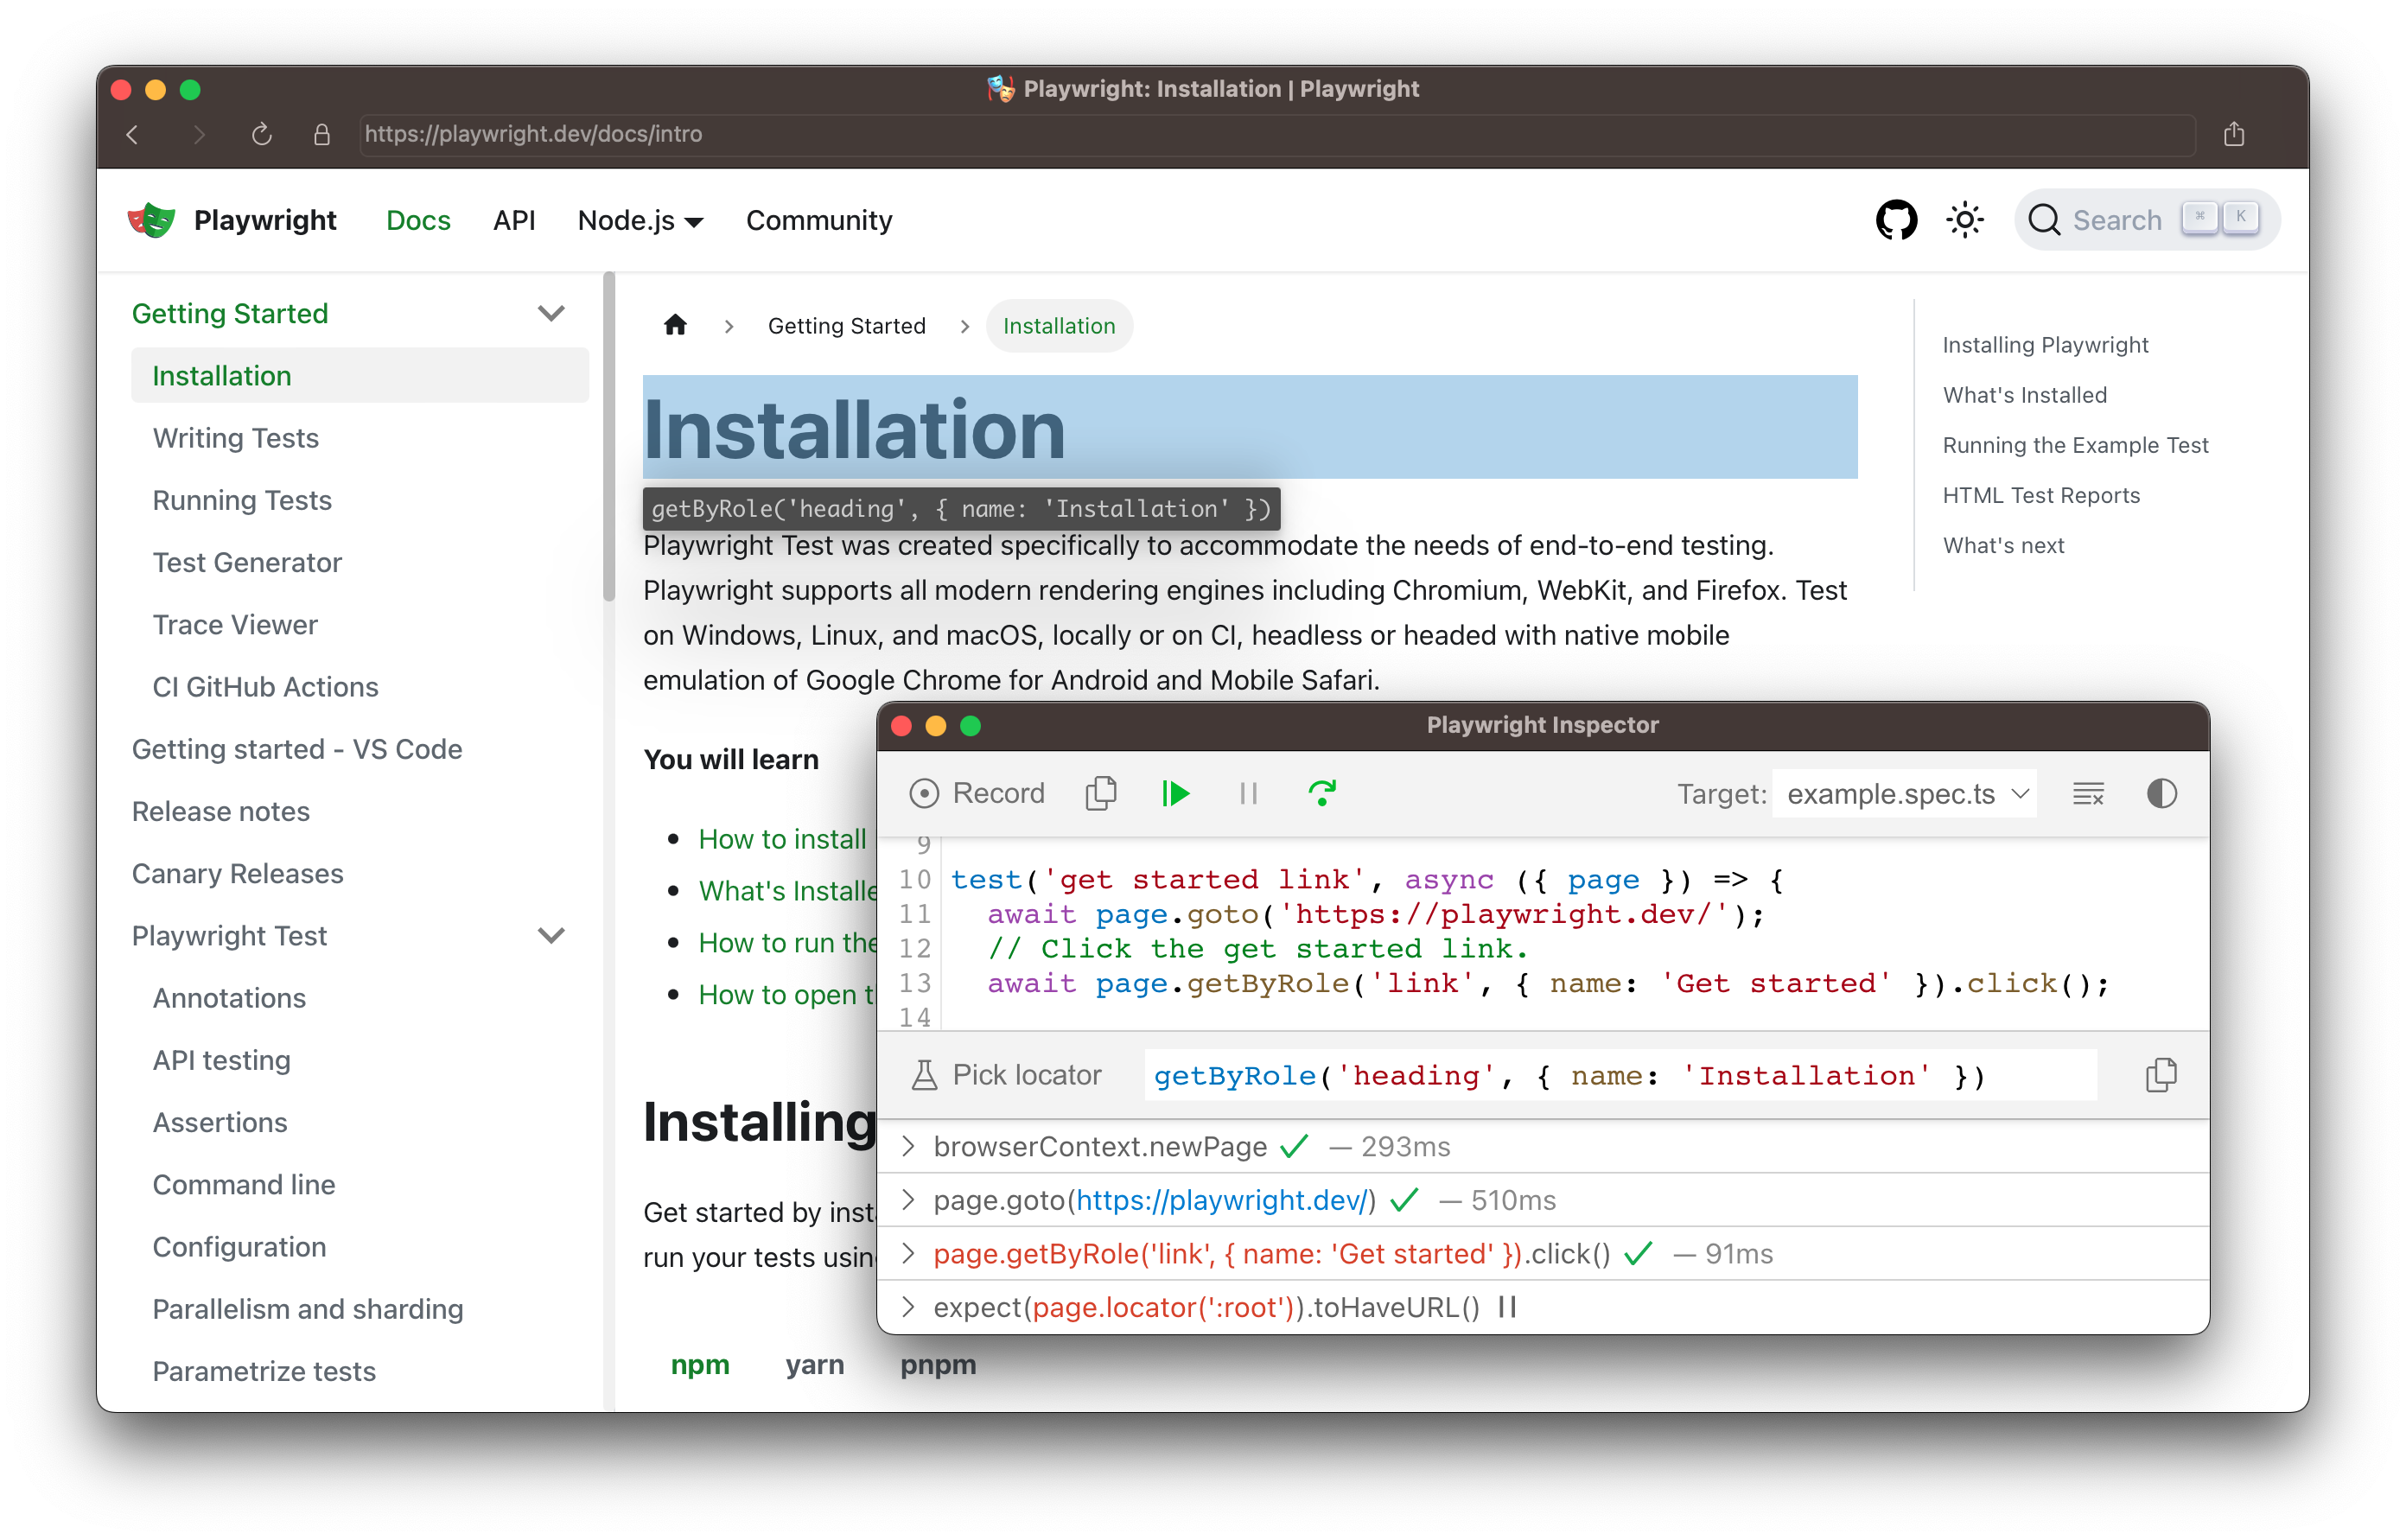
Playwright 检查器
🌐 Playwright Inspector
Playwright Inspector 是一个 GUI 工具,可帮助你调试 Playwright 测试。它允许你逐步执行测试、实时编辑定位器、选择定位器并查看可操作性日志。
🌐 The Playwright Inspector is a GUI tool to help you debug your Playwright tests. It allows you to step through your tests, live edit locators, pick locators and see actionability logs.
在调试模式下运行
🌐 Run in debug mode
使用 --debug 标志运行测试以打开检查器。这会将 Playwright 配置为调试模式并打开检查器。当使用 --debug 时,还会配置其他有用的默认值:
🌐 Run your tests with the --debug flag to open the inspector. This configures Playwright for debugging and opens the inspector. Additional useful defaults are configured when --debug is used:
- 浏览器以 head 模式启动
- 默认超时设置为 0(= 无超时)
在所有浏览器上调试所有测试
🌐 Debug all tests on all browsers
要调试所有测试,请使用 --debug 标志运行测试命令。这将逐个运行测试,并为每个测试打开检查器和浏览器窗口。
🌐 To debug all tests run the test command with the --debug flag. This will run tests one by one, and open the inspector and a browser window for each test.
npx playwright test --debug
在所有浏览器上调试一项测试
🌐 Debug one test on all browsers
要在特定行调试一个测试,请运行测试命令,然后跟上测试文件的名称和要调试的测试行号,再加上 --debug 标志。这将会在你 playwright.config 配置的每个浏览器中运行单个测试,并打开检查器。
🌐 To debug one test on a specific line, run the test command followed by the name of the test file and the line number of the test you want to debug, followed by the --debug flag. This will run a single test in each browser configured in your playwright.config and open the inspector.
npx playwright test example.spec.ts:10 --debug
在特定浏览器上调试
🌐 Debug on a specific browser
在 Playwright 中,你可以在你的 playwright.config 中配置项目。配置完成后,你可以使用 --project 标志,后跟在 playwright.config 中配置的项目名称,在特定的浏览器或移动视口上调试你的测试。
🌐 In Playwright you can configure projects in your playwright.config. Once configured you can then debug your tests on a specific browser or mobile viewport using the --project flag followed by the name of the project configured in your playwright.config.
npx playwright test --project=chromium --debug
npx playwright test --project="Mobile Safari" --debug
npx playwright test --project="Microsoft Edge" --debug
在特定浏览器上调试一项测试
🌐 Debug one test on a specific browser
要在特定浏览器上运行一个测试,请添加测试文件的名称和要调试的测试的行号,以及 --project 标志,后面跟上项目名称。
🌐 To run one test on a specific browser add the name of the test file and the line number of the test you want to debug as well as the --project flag followed by the name of the project.
npx playwright test example.spec.ts:10 --project=webkit --debug
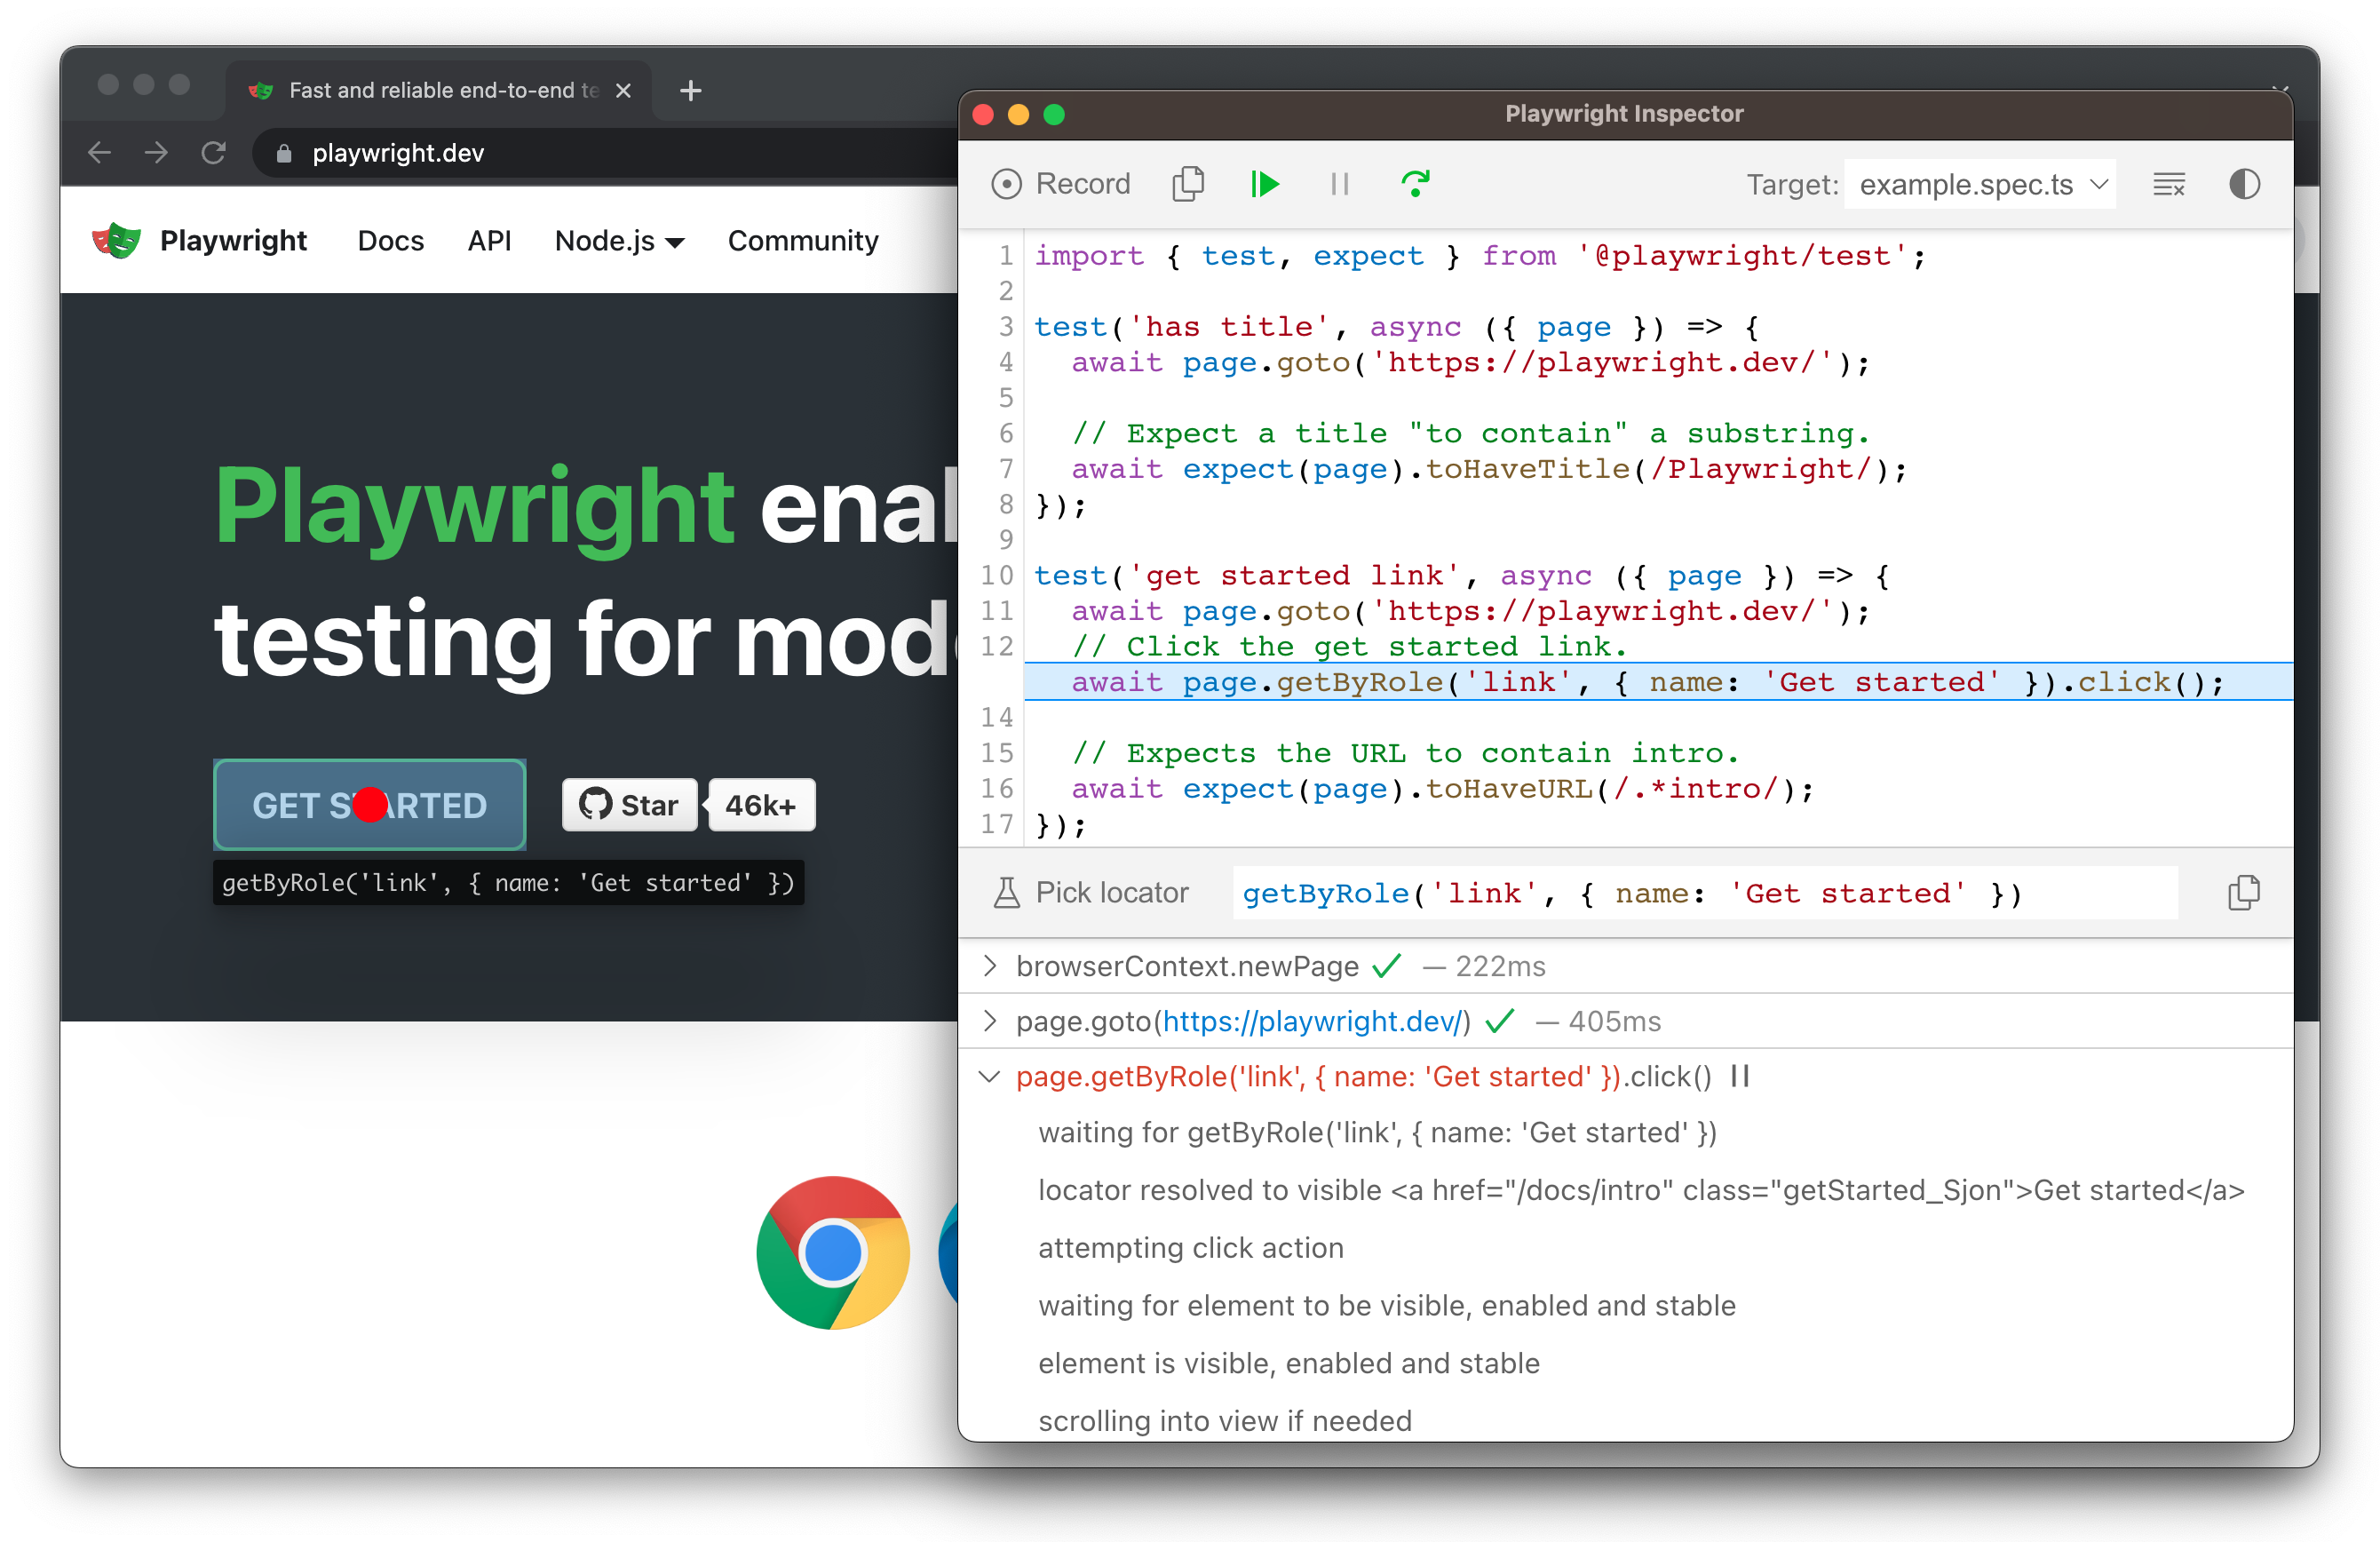
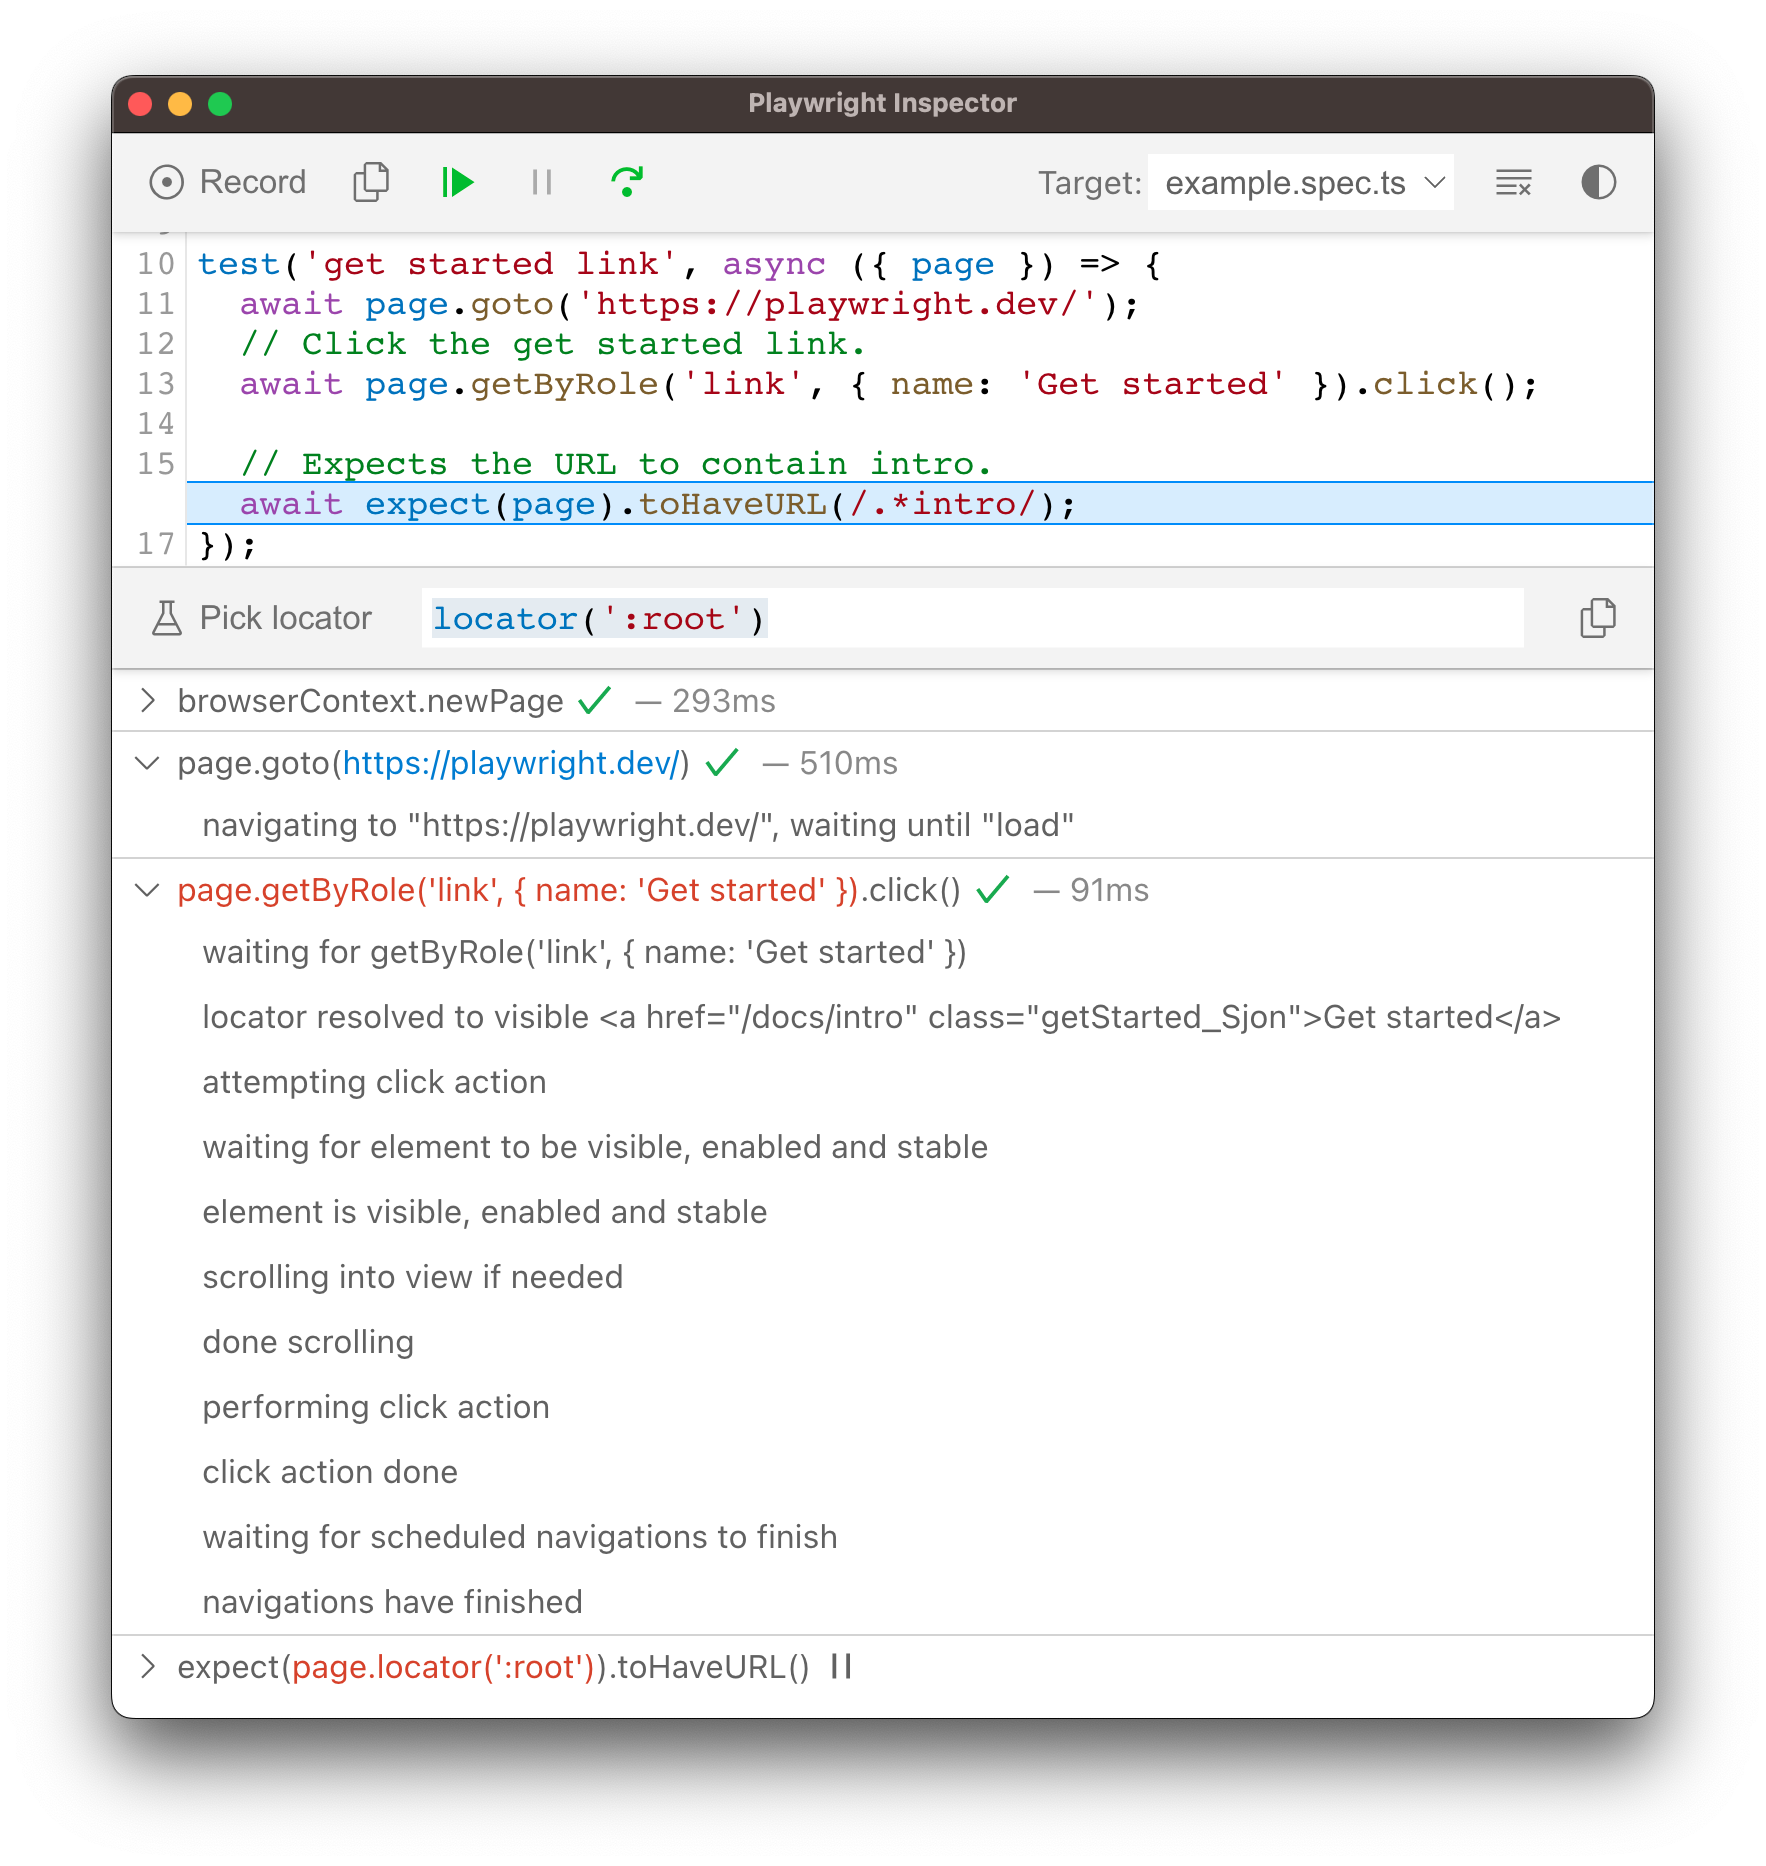
逐步完成你的测试
🌐 Stepping through your tests
你可以使用检查器顶部的工具栏播放、暂停或逐步执行测试的每个操作。你可以在测试代码中看到当前操作被高亮显示,并在浏览器窗口中看到匹配的元素被高亮显示。
🌐 You can play, pause or step through each action of your test using the toolbar at the top of the Inspector. You can see the current action highlighted in the test code, and matching elements highlighted in the browser window.
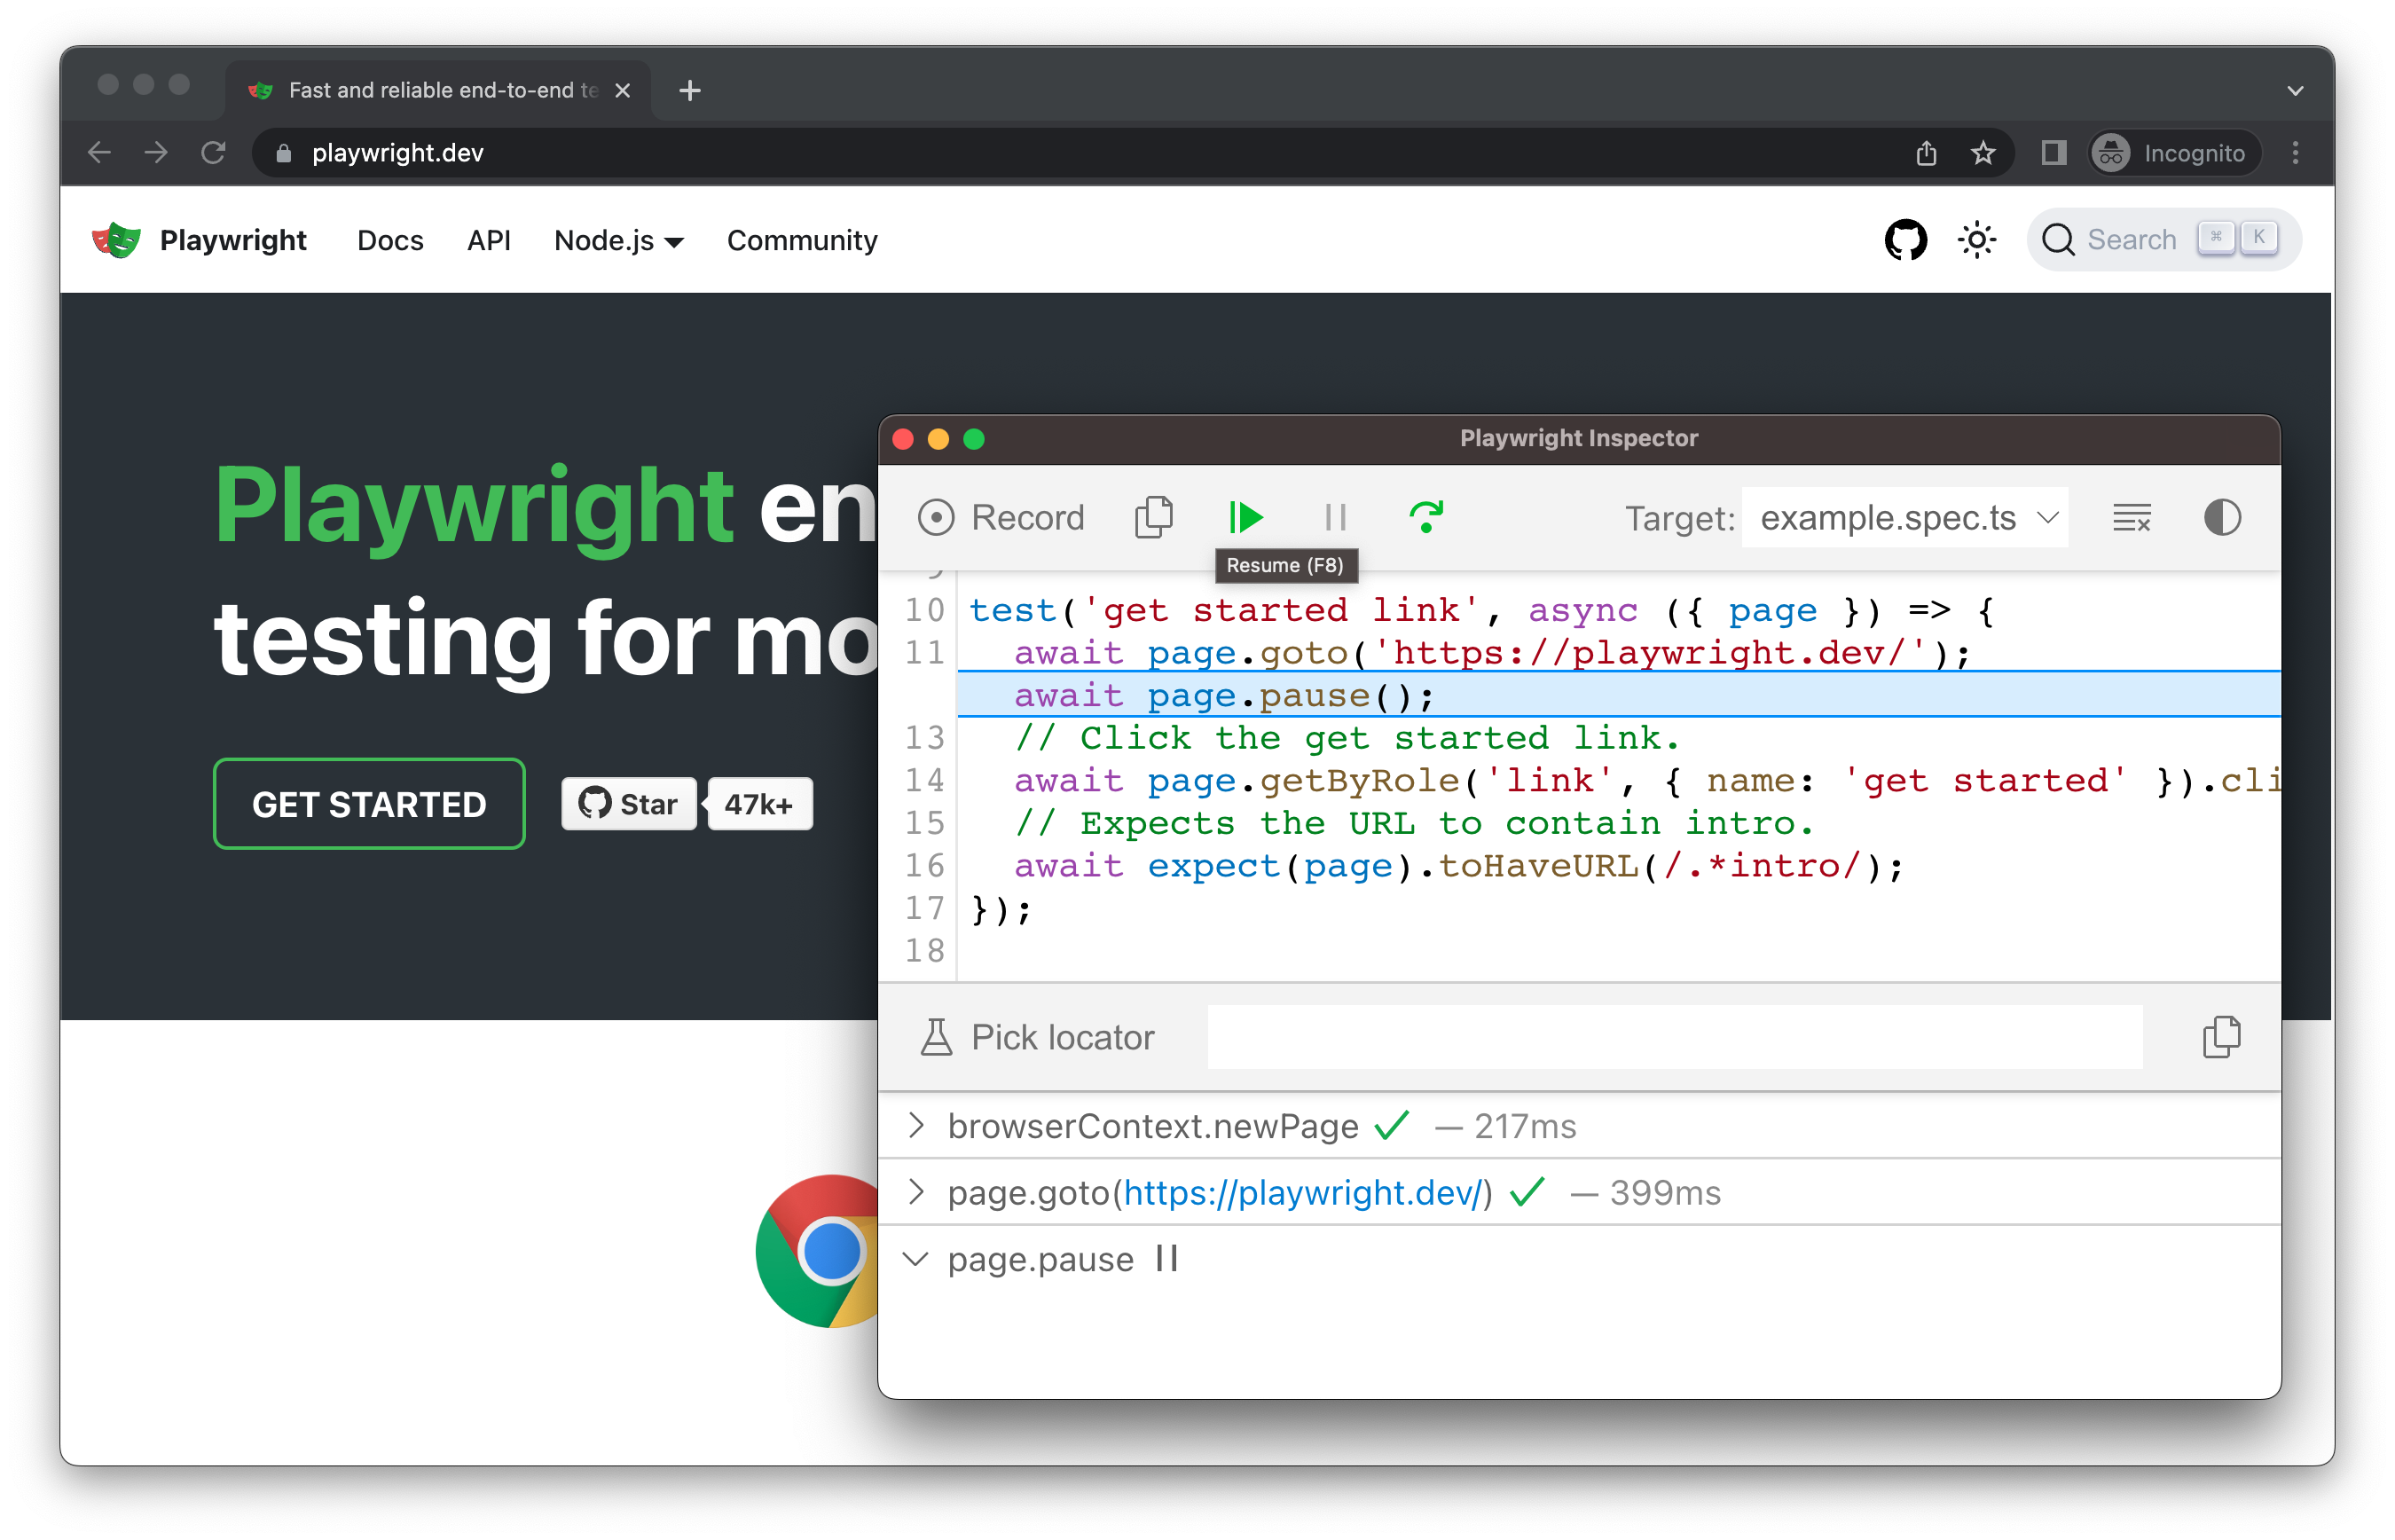
从特定断点运行测试
🌐 Run a test from a specific breakpoint
为了加快调试过程,你可以在测试中添加一个 page.pause() 方法。这样你就不必逐步执行测试中的每一个操作,只需直接到达你想要调试的点。
🌐 To speed up the debugging process you can add a page.pause() method to your test. This way you won't have to step through each action of your test to get to the point where you want to debug.
await page.pause();
一旦你添加了 page.pause() 调用,就在调试模式下运行你的测试。在检查器中点击“继续”按钮将运行测试,并且只会在 page.pause() 处停止。
🌐 Once you add a page.pause() call, run your tests in debug mode. Clicking the "Resume" button in the Inspector will run the test and only stop on the page.pause().
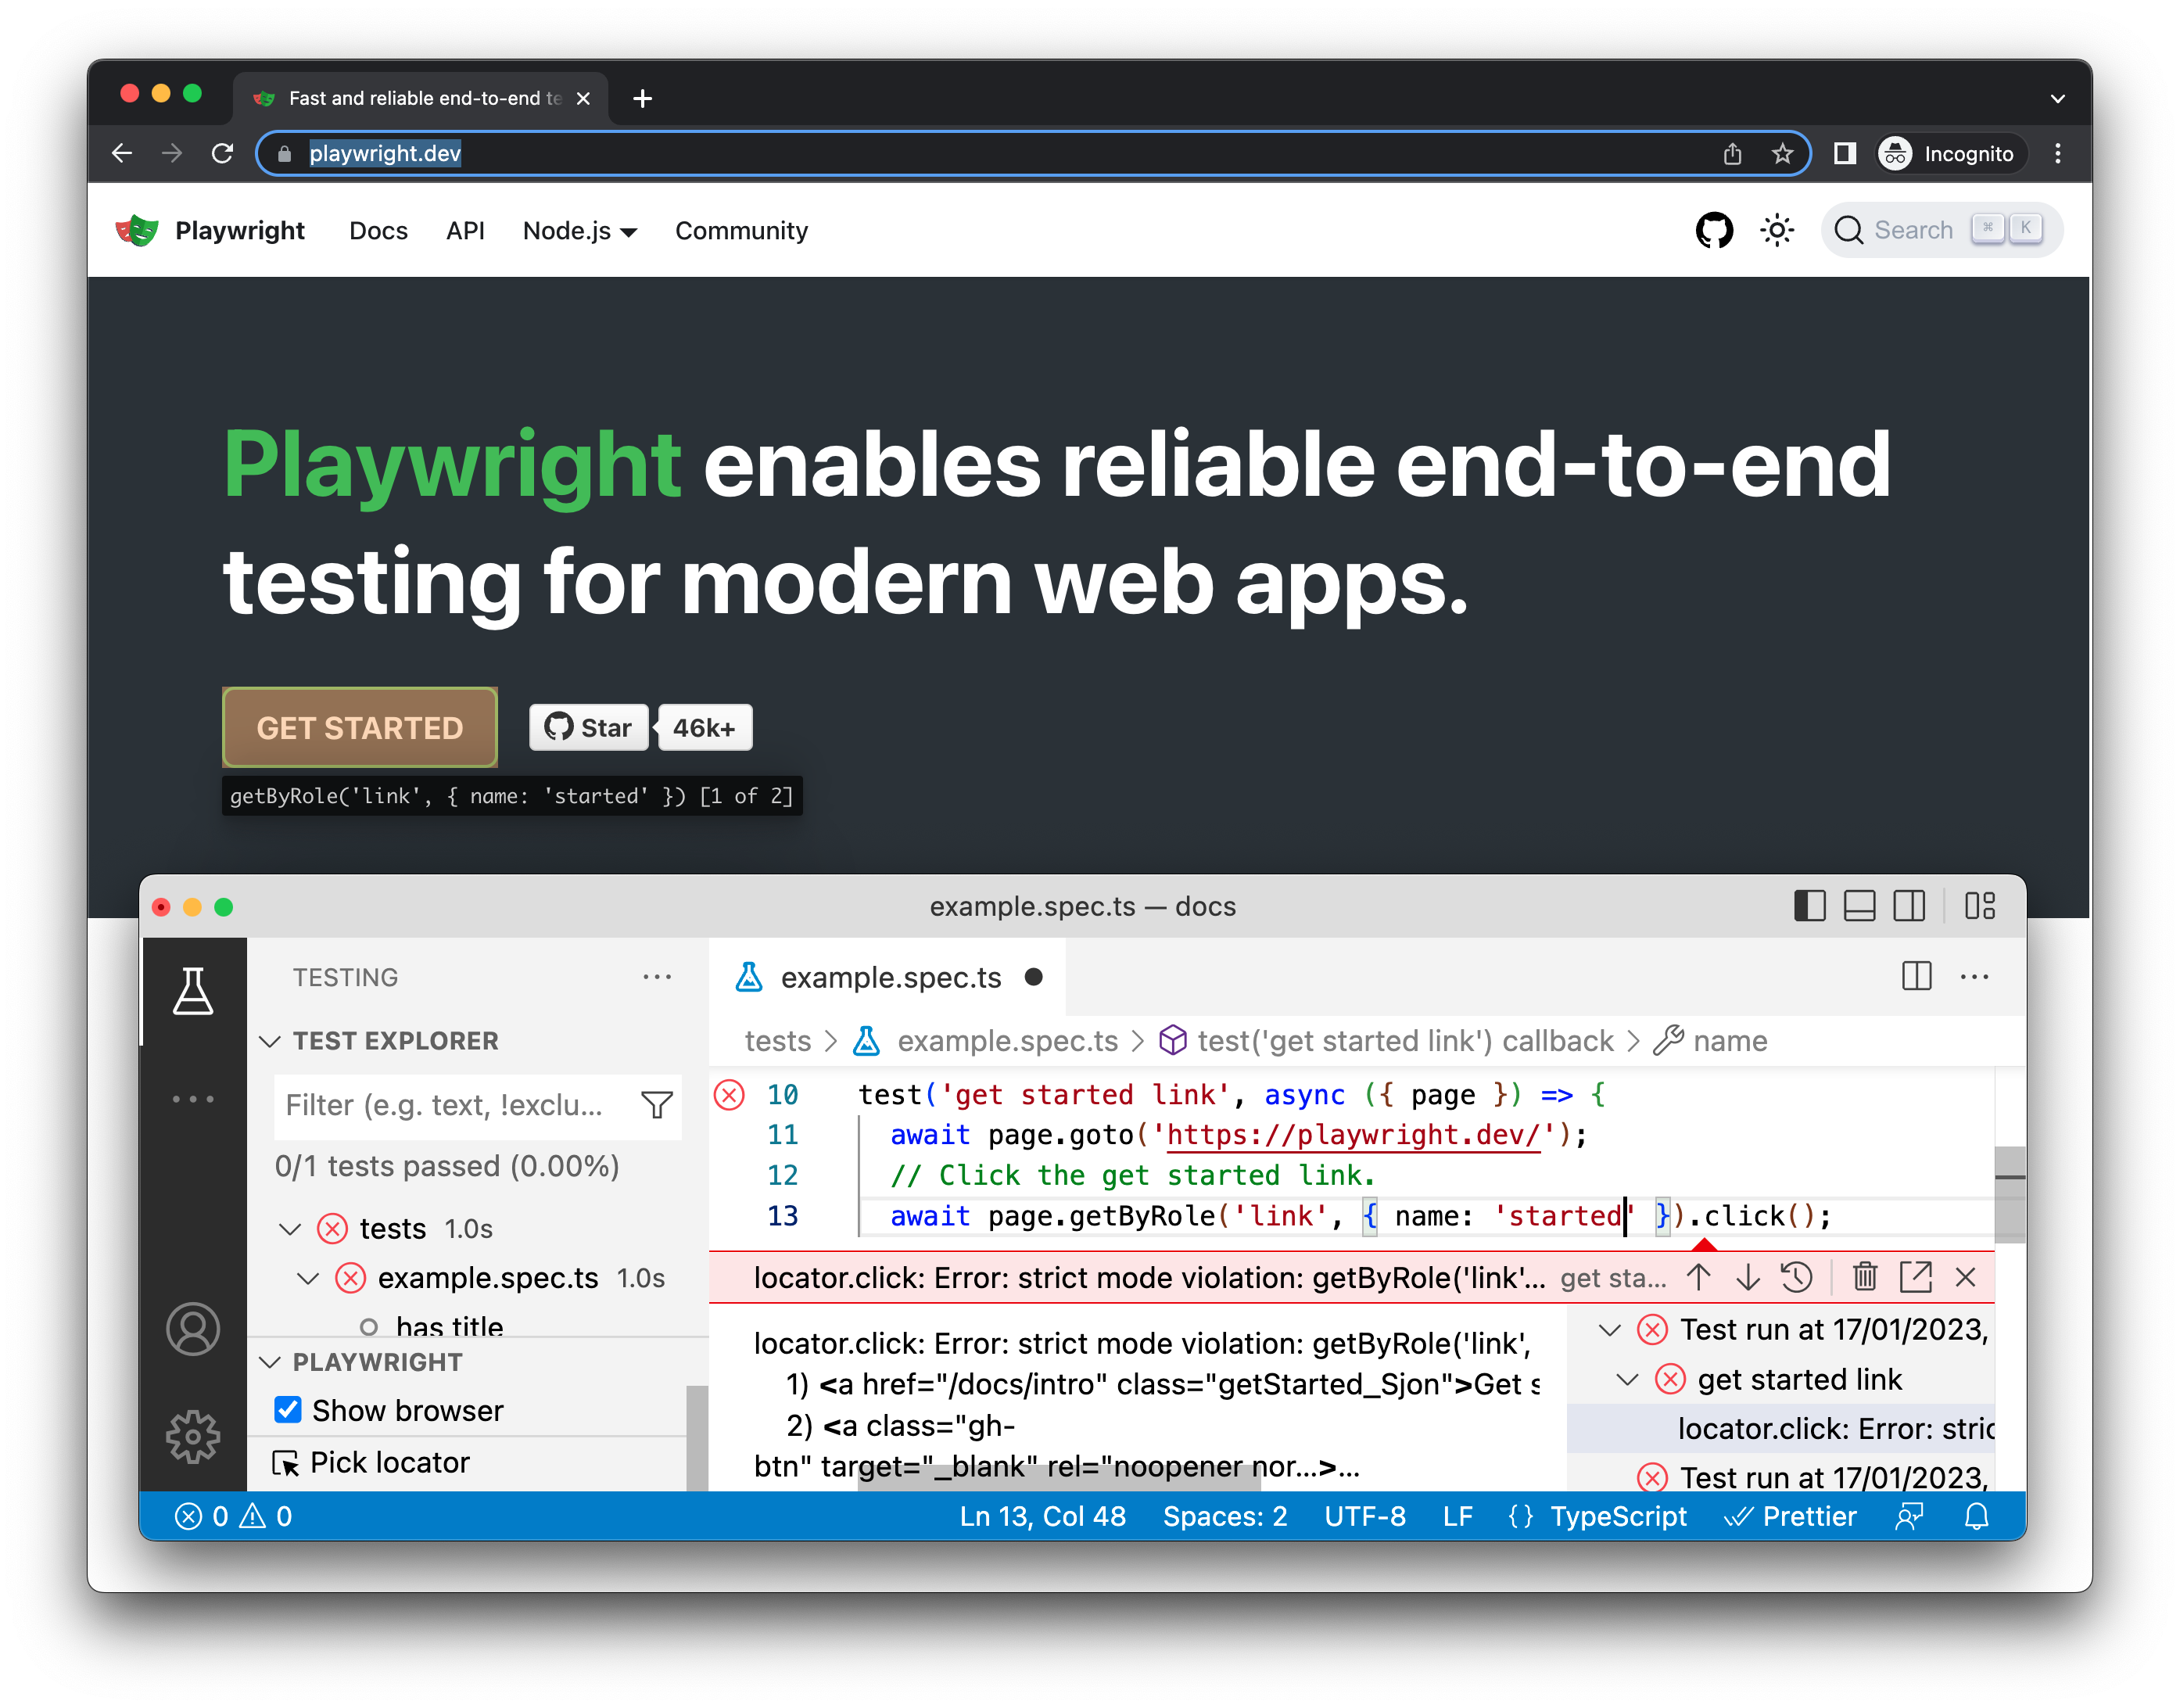
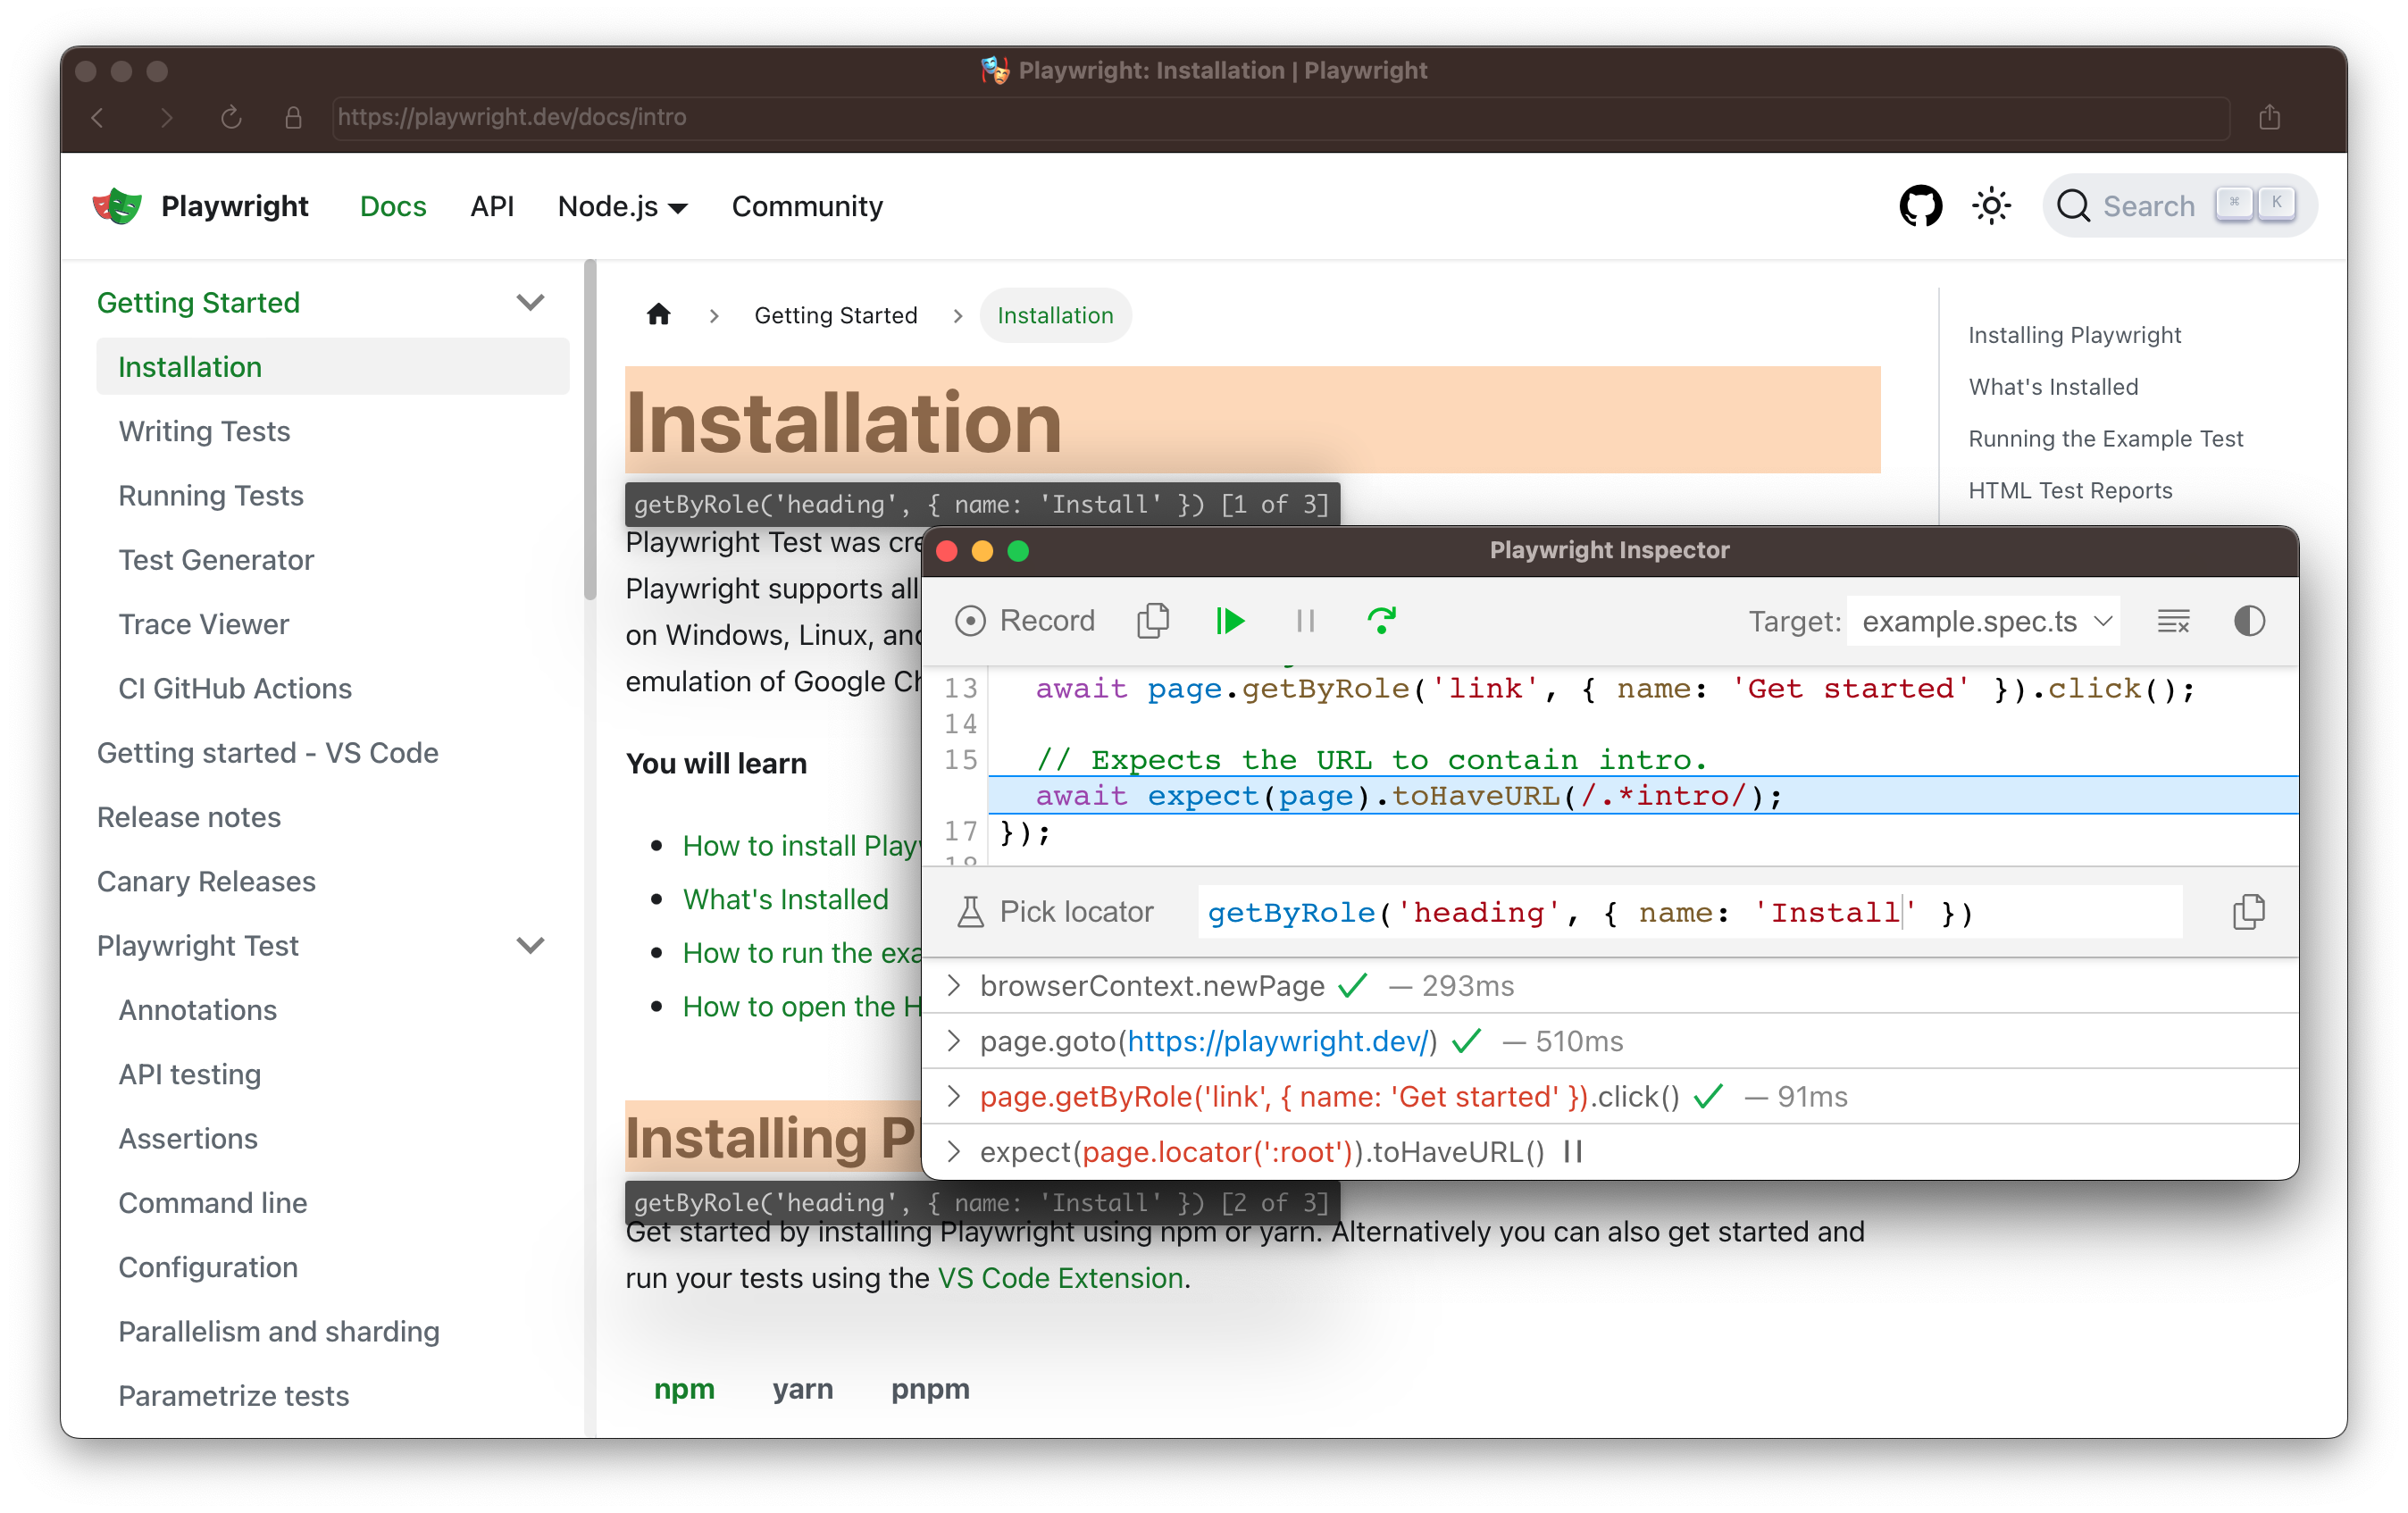
实时编辑定位器
🌐 Live editing locators
在调试模式下运行时,你可以实时编辑定位器。在“选择定位器”按钮旁边有一个字段显示测试暂停时的定位器 locator。你可以直接在 选择定位器 字段中编辑此定位器,匹配的元素将在浏览器窗口中高亮显示。
🌐 While running in debug mode you can live edit the locators. Next to the 'Pick Locator' button there is a field showing the locator that the test is paused on. You can edit this locator directly in the Pick Locator field, and matching elements will be highlighted in the browser window.
拣选定位器
🌐 Picking locators
在调试时,你可能需要选择一个更稳健的定位器。你可以通过点击 选择定位器 按钮,并将鼠标悬停在浏览器窗口中的任何元素上来实现。在悬停元素时,下面会高亮显示定位该元素所需的代码。点击浏览器中的某个元素会将定位器添加到字段中,然后你可以对其进行调整或复制到代码中。
🌐 While debugging, you might need to choose a more resilient locator. You can do this by clicking on the Pick Locator button and hovering over any element in the browser window. While hovering over an element you will see the code needed to locate this element highlighted below. Clicking an element in the browser will add the locator into the field where you can then either tweak it or copy it into your code.
Playwright 会查看你的页面并找出最佳定位器,优先考虑 role、text 和 test id 定位器。如果 Playwright 发现有多个元素匹配该定位器,它会改进定位器,使其具有弹性并能唯一识别目标元素,这样你就不必担心测试因定位器失败而出错。
🌐 Playwright will look at your page and figure out the best locator, prioritizing role, text and test id locators. If Playwright finds multiple elements matching the locator, it will improve the locator to make it resilient and uniquely identify the target element, so you don't have to worry about failing tests due to locators.
可操作性日志
🌐 Actionability logs
当 Playwright 在点击操作上暂停时,它已经执行了可以在日志中找到的可操作性检查。这可以帮助你了解测试过程中发生了什么,以及 Playwright 做了什么或尝试做了什么。日志会告诉你元素是否可见、是否可用且稳定,定位器是否解析为元素,是否滚动到视图中,等等。如果无法达到可操作性,它会显示操作为等待状态。
🌐 By the time Playwright has paused on a click action, it has already performed actionability checks that can be found in the log. This can help you understand what happened during your test and what Playwright did or tried to do. The log tells you if the element was visible, enabled and stable, if the locator resolved to an element, scrolled into view, and so much more. If actionability can't be reached, it will show the action as pending.
跟踪查看器
🌐 Trace Viewer
Playwright Trace Viewer 是一个 GUI 工具,可让你探索测试的 Playwright 录制轨迹。你可以在左侧前后浏览每个操作,并直观地看到操作期间发生的情况。在屏幕中间,你可以看到该操作的 DOM 快照。在右侧,你可以查看操作详情,如时间、参数、返回值和日志。你还可以查看控制台消息、网络请求和源代码。
🌐 Playwright Trace Viewer is a GUI tool that lets you explore recorded Playwright traces of your tests. You can go back and forward through each action on the left side, and visually see what was happening during the action. In the middle of the screen, you can see a DOM snapshot for the action. On the right side you can see action details, such as time, parameters, return value and log. You can also explore console messages, network requests and the source code.
要了解更多关于如何记录跟踪和使用跟踪查看器的信息,请查看跟踪查看器指南。
🌐 To learn more about how to record traces and use the Trace Viewer, check out the Trace Viewer guide.
浏览器开发者工具
🌐 Browser Developer Tools
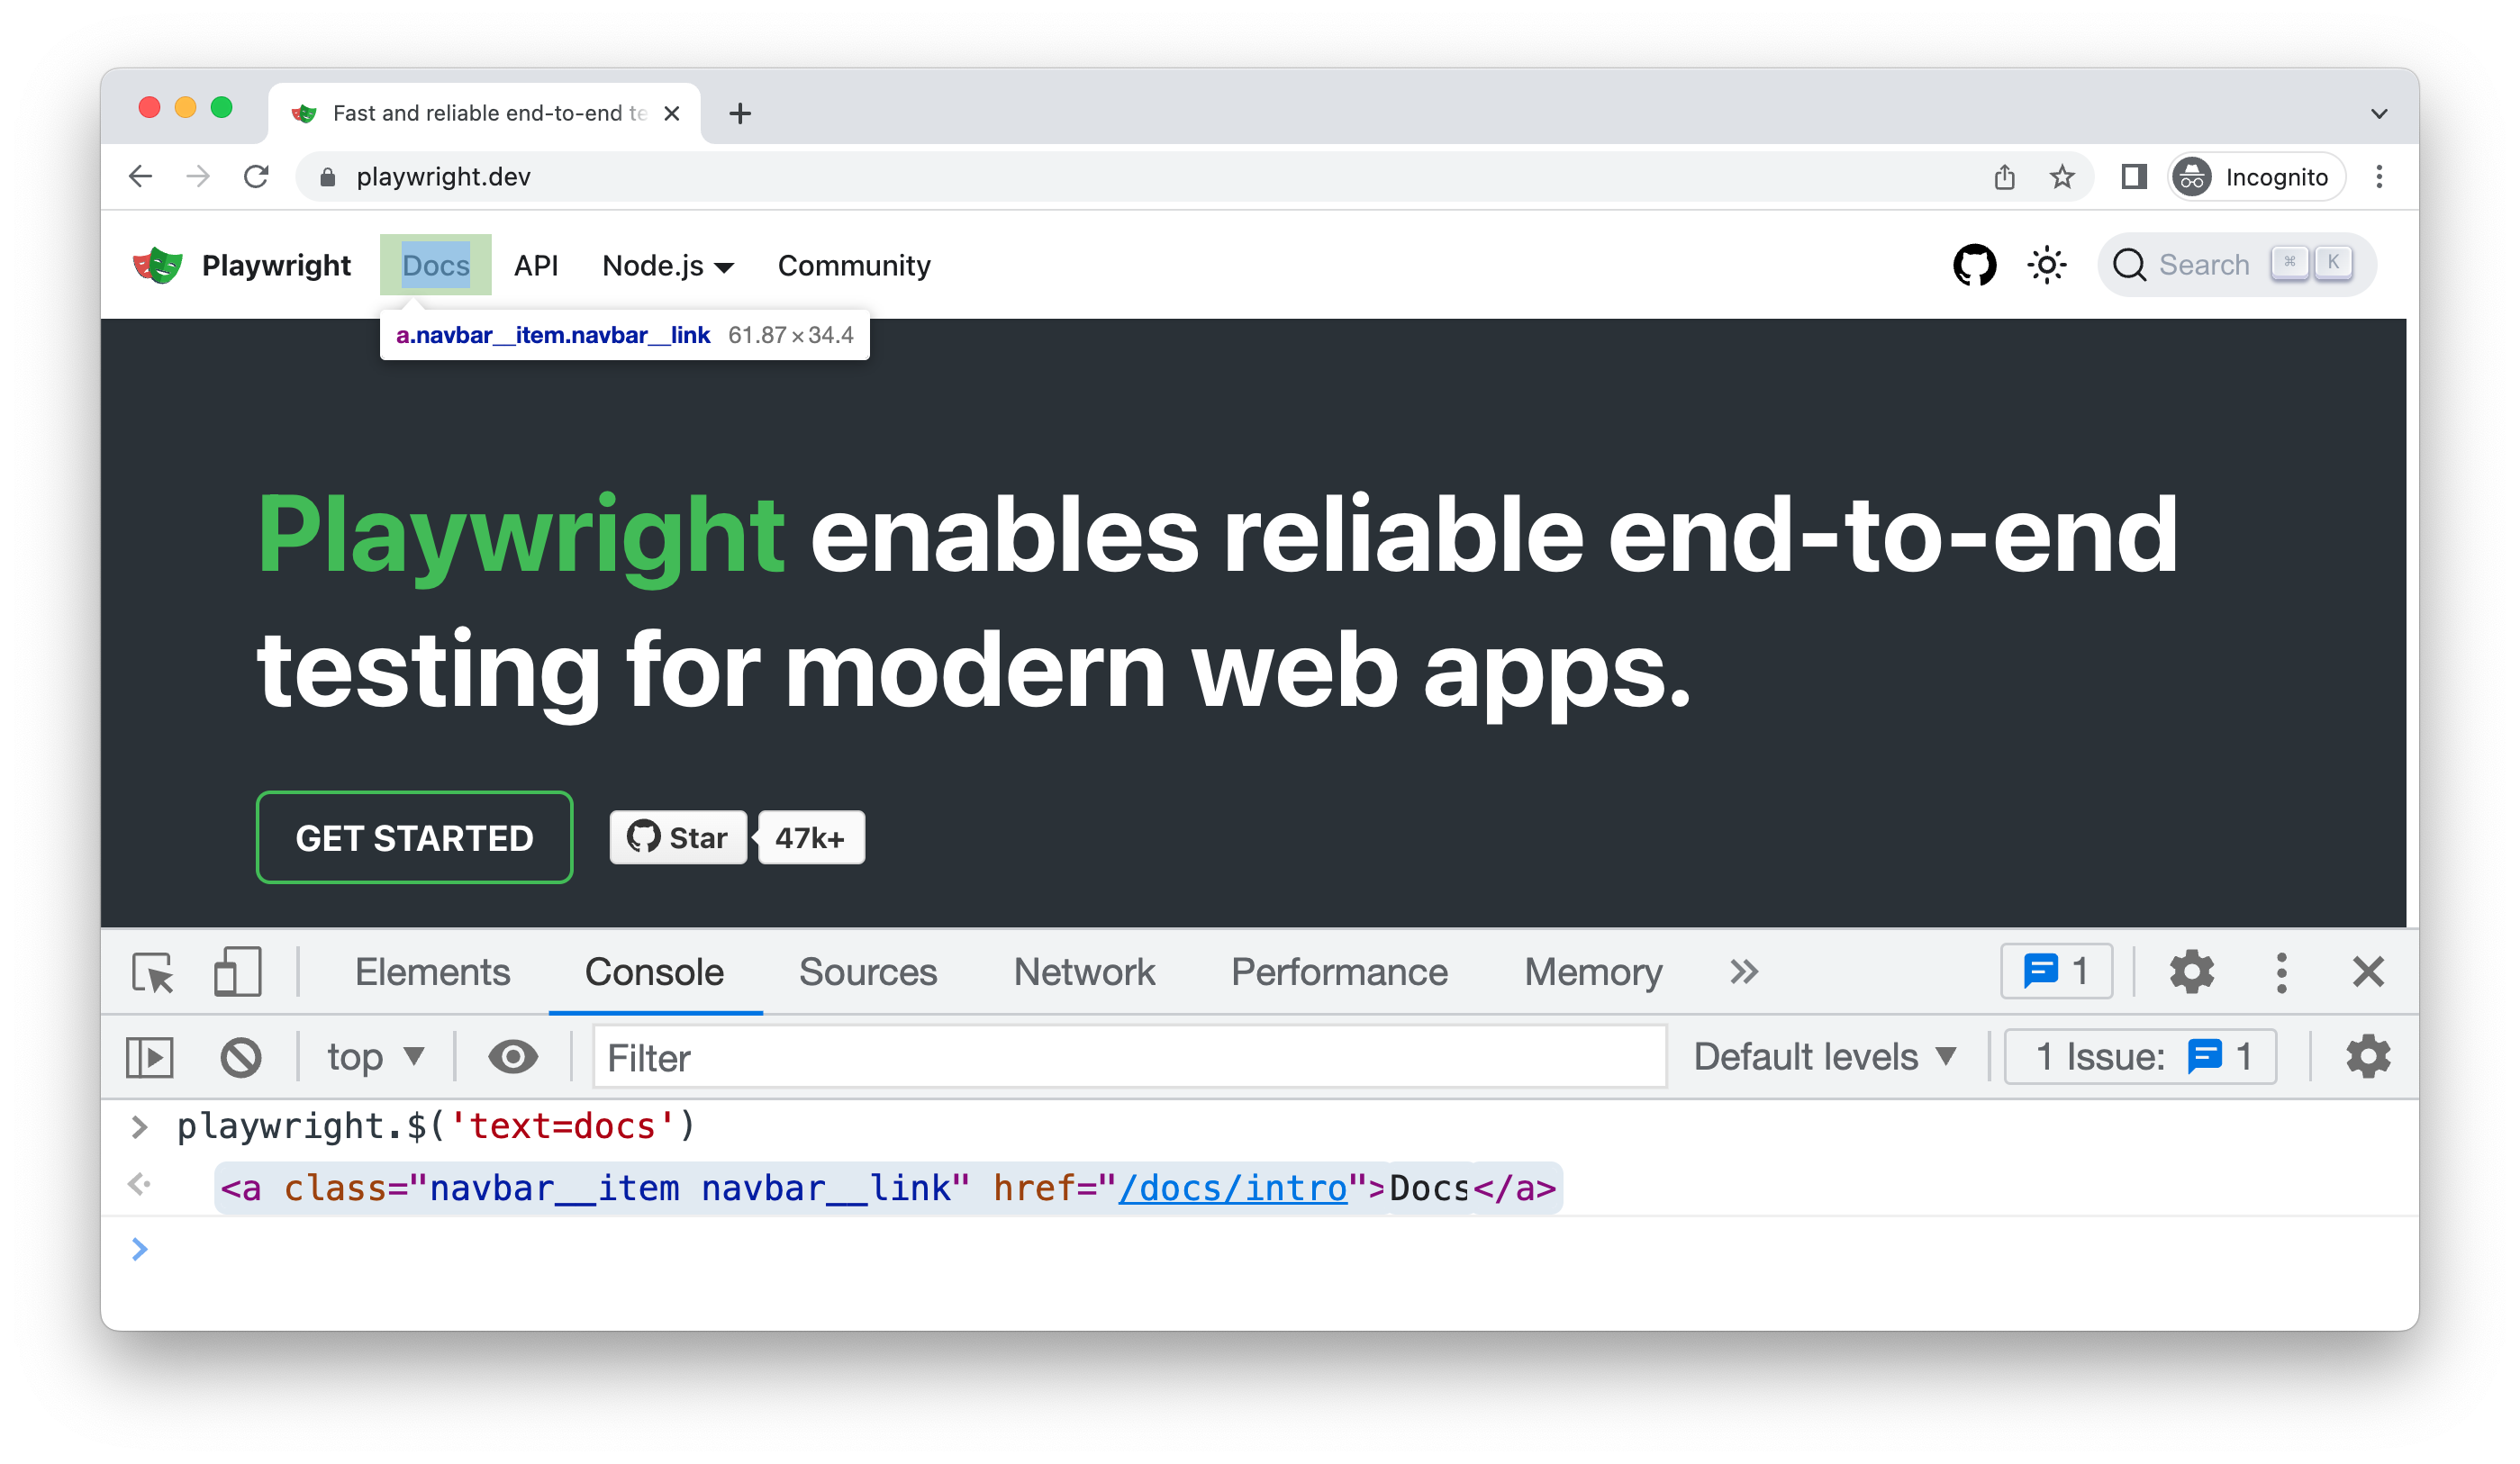
在使用 PWDEBUG=console 的调试模式下运行时,开发者工具控制台中可以使用 playwright 对象。开发者工具可以帮助你:
🌐 When running in Debug Mode with PWDEBUG=console, a playwright object is available in the Developer tools console. Developer tools can help you to:
- 检查 DOM 树并查找元素选择器
- 在执行期间查看控制台日志(或了解如何通过 API 阅读日志)
- 检查 网络活动 和其他开发者工具功能
要使用浏览器开发者工具调试你的测试,请先在测试中设置一个断点,通过 page.pause() 方法暂停执行。
🌐 To debug your tests using the browser developer tools, start by setting a breakpoint in your test to pause the execution using the page.pause() method.
await page.pause();
一旦你在测试中设置了断点,就可以使用 PWDEBUG=console 运行你的测试。
🌐 Once you have set a breakpoint in your test, you can then run your test with PWDEBUG=console.
- Bash
- PowerShell
- Batch
PWDEBUG=console npx playwright test
$env:PWDEBUG="console"
npx playwright test
set PWDEBUG=console
npx playwright test
一旦 Playwright 启动浏览器窗口,你就可以打开开发者工具。playwright 对象将在控制台面板中可用。
🌐 Once Playwright launches the browser window, you can open the developer tools. The playwright object will be available in the console panel.
playwright.$(selector)
使用实际的 Playwright 查询引擎查询 Playwright 选择器,例如:
🌐 Query the Playwright selector, using the actual Playwright query engine, for example:
playwright.$('.auth-form >> text=Log in');

<button>Log in</button>
playwright.$$(selector)
与 playwright.$ 相同,但返回所有匹配的元素。
🌐 Same as playwright.$, but returns all matching elements.
playwright.$$('li >> text=John')

[<li>, <li>, <li>, <li>]
playwright.inspect(selector)
在元素面板中显示元素。
🌐 Reveal element in the Elements panel.
playwright.inspect('text=Log in')
playwright.locator(selector)
创建定位器并查询匹配元素,例如:
🌐 Create a locator and query matching elements, for example:
playwright.locator('.auth-form', { hasText: 'Log in' });

Locator ()
  - element: button
  - elements: [button]
playwright.selector(element)
为给定的元素生成选择器。例如,在元素面板中选择一个元素并传入 $0:
🌐 Generates selector for the given element. For example, select an element in the Elements panel and pass $0:
playwright.selector($0)

"div[id="glow-ingress-block"] >> text=/.*Hello.*/"
详细 API 日志
🌐 Verbose API logs
Playwright 支持使用 DEBUG 环境变量进行详细日志记录。
🌐 Playwright supports verbose logging with the DEBUG environment variable.
- Bash
- PowerShell
- Batch
DEBUG=pw:api npx playwright test
$env:DEBUG="pw:api"
npx playwright test
set DEBUG=pw:api
npx playwright test
对于 WebKit:在执行过程中启动 WebKit 检查器将阻止 Playwright 脚本的进一步执行,并会重置预先配置的用户代理和设备模拟。
有头模式
🌐 Headed mode
Playwright 默认以无头模式运行浏览器。要更改此行为,请将 headless: false 用作启动选项。
🌐 Playwright runs browsers in headless mode by default. To change this behavior, use headless: false as a launch option.
你也可以使用 slowMo 选项来减慢执行速度(每个操作延迟 N 毫秒),并在调试时跟踪进程。
🌐 You can also use the slowMo option to slow down execution (by N milliseconds per operation) and follow along while debugging.
// Chromium, Firefox, or WebKit
await chromium.launch({ headless: false, slowMo: 100 });