跟踪查看器
介绍
🌐 Introduction
Playwright Trace Viewer 是一个图形界面工具,可帮助你在脚本运行后探索已记录的 Playwright 跟踪。当测试在 CI 上失败时,跟踪是调试测试的好方法。你可以在本地 打开跟踪 或在浏览器中访问 trace.playwright.dev 打开跟踪。
🌐 Playwright Trace Viewer is a GUI tool that helps you explore recorded Playwright traces after the script has run. Traces are a great way for debugging your tests when they fail on CI. You can open traces locally or in your browser on trace.playwright.dev.
打开跟踪查看器
🌐 Opening Trace Viewer
你可以使用 Playwright CLI 或在浏览器中通过 trace.playwright.dev 打开已保存的跟踪。请确保添加你的 trace.zip 文件所在的完整路径。
🌐 You can open a saved trace using either the Playwright CLI or in the browser at trace.playwright.dev. Make sure to add the full path to where your trace.zip file is located.
playwright show-trace trace.zip
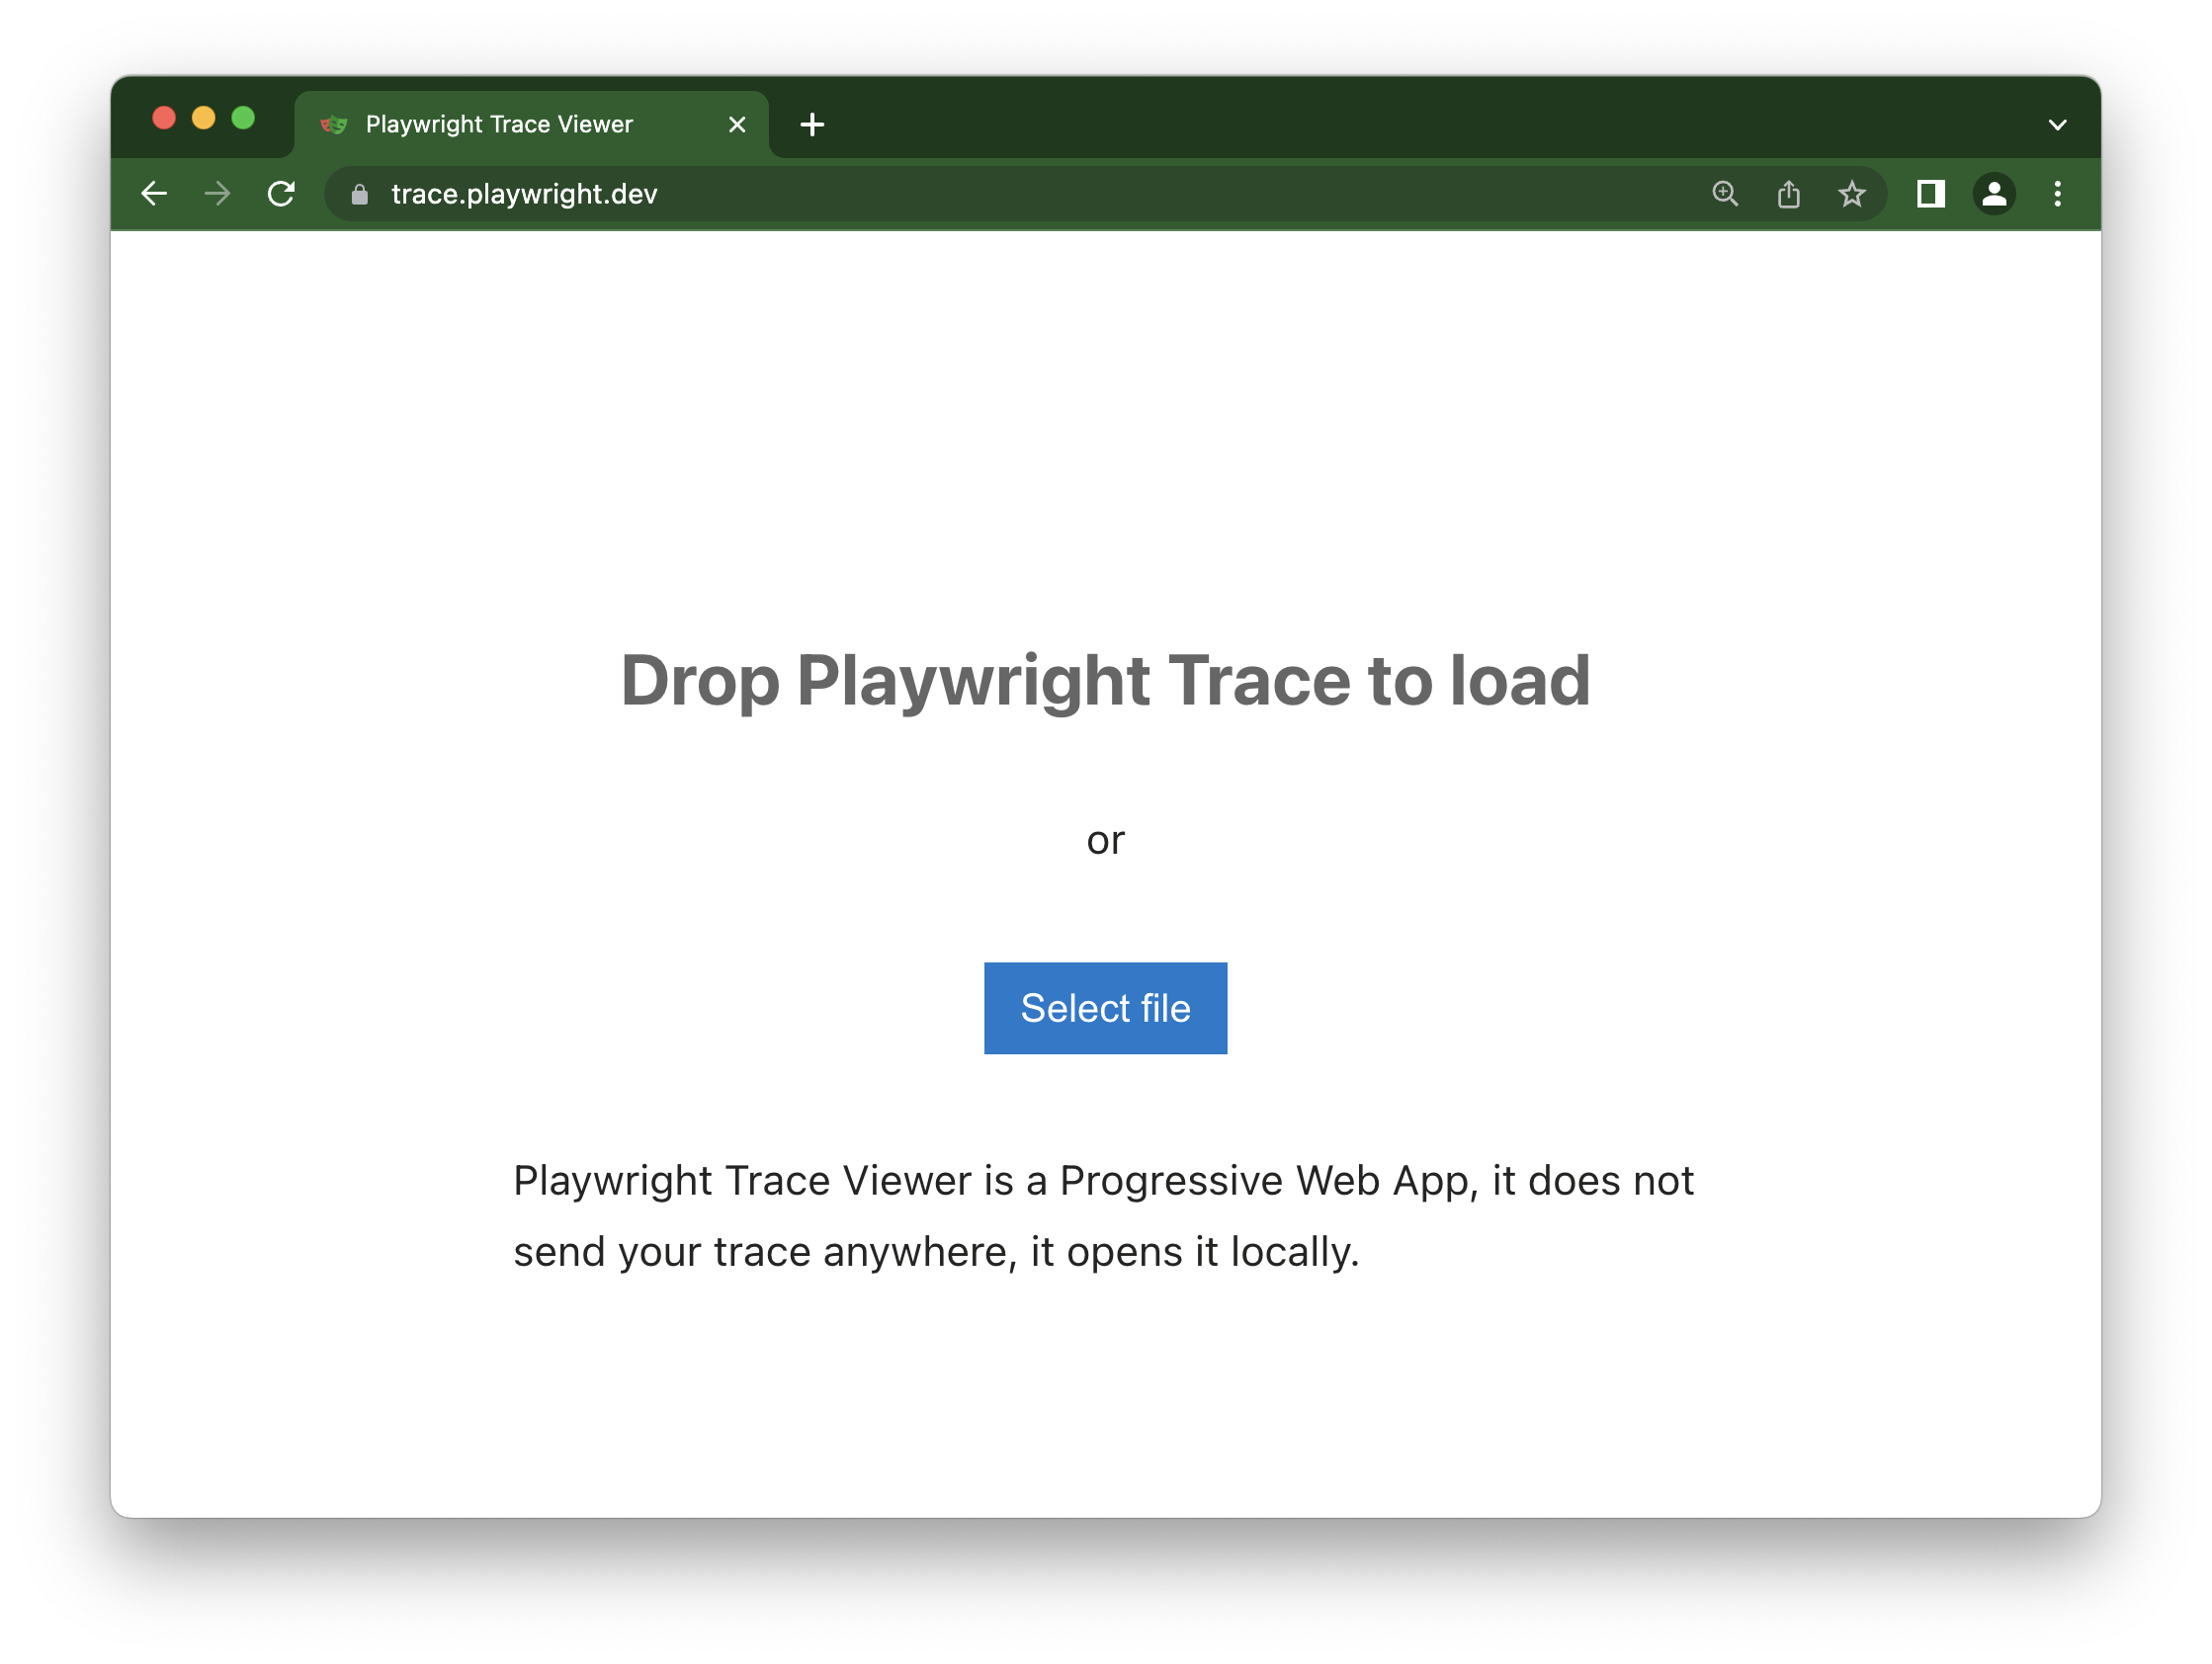
使用 trace.playwright.dev
🌐 Using trace.playwright.dev
trace.playwright.dev 是 Trace Viewer 的静态托管版本。你可以通过拖放或点击 Select file 按钮上传 trace 文件。
Trace Viewer 会将跟踪完全加载到你的浏览器中,而不会向外部传输任何数据。
🌐 Trace Viewer loads the trace entirely in your browser and does not transmit any data externally.
查看远程痕迹
🌐 Viewing remote traces
你可以直接使用其 URL 打开远程追踪。这使得查看远程追踪变得更加容易,而无需手动从 CI 运行中下载文件,例如。
🌐 You can open remote traces directly using its URL. This makes it easy to view the remote trace without having to manually download the file from CI runs, for example.
playwright show-trace https://example.com/trace.zip
在使用 trace.playwright.dev 时,你也可以将上传的 trace 的 URL(存放在可访问的存储中,例如你的 CI 内)作为查询参数传递。可能会受 CORS(跨域资源共享)规则的限制。
🌐 When using trace.playwright.dev, you can also pass the URL of your uploaded trace at some accessible storage (e.g. inside your CI) as a query parameter. CORS (Cross-Origin Resource Sharing) rules might apply.
https://trace.playwright.dev/?trace=https://demo.playwright.dev/reports/todomvc/data/e6099cadf79aa753d5500aa9508f9d1dbd87b5ee.zip
记录跟踪
🌐 Recording a trace
可以通过使用 --tracing 标志运行测试来记录跟踪。
🌐 Traces can be recorded by running your tests with the --tracing flag.
pytest --tracing on
用于跟踪的选项包括:
🌐 Options for tracing are:
on:记录每个测试的跟踪信息off:不记录跟踪。(默认)retain-on-failure:记录每个测试的跟踪信息,但删除所有成功测试运行的跟踪信息。
这将记录跟踪并将其放入位于你的 test-results 目录中的名为 trace.zip 的文件中。
🌐 This will record the trace and place it into the file named trace.zip in your test-results directory.
如果你没有使用 Pytest,点击此处了解如何记录跟踪。
- Sync
- Async
browser = chromium.launch()
context = browser.new_context()

# Start tracing before creating / navigating a page.
context.tracing.start(screenshots=True, snapshots=True, sources=True)

page = context.new_page()
page.goto("https://playwright.nodejs.cn")

# Stop tracing and export it into a zip archive.
context.tracing.stop(path = "trace.zip")
browser = await chromium.launch()
context = await browser.new_context()

# Start tracing before creating / navigating a page.
await context.tracing.start(screenshots=True, snapshots=True, sources=True)

page = await context.new_page()
await page.goto("https://playwright.nodejs.cn")

# Stop tracing and export it into a zip archive.
await context.tracing.stop(path = "trace.zip")
跟踪查看器功能
🌐 Trace Viewer features
行动
🌐 Actions
在动作标签页中,你可以看到每个动作用了哪个定位器,以及每个动作运行了多长时间。鼠标悬停在测试的每个动作上,直观地看到DOM快照中的变化。时光倒流,点击一个作来检查和调试。使用“前后”标签页,直观地查看动作前后发生了什么。
🌐 In the Actions tab you can see what locator was used for every action and how long each one took to run. Hover over each action of your test and visually see the change in the DOM snapshot. Go back and forward in time and click an action to inspect and debug. Use the Before and After tabs to visually see what happened before and after the action.
选择每个操作显示:
- 操作快照
- 操作日志
- 源代码位置
截图
🌐 Screenshots
在启用 截图 选项(默认)进行跟踪时,每次跟踪都会记录一个屏幕录制并将其渲染为影片条。你可以将鼠标悬停在影片条上,以查看每个操作和状态的放大图片,这可以帮助你轻松找到想要检查的操作。
🌐 When tracing with the screenshots option turned on (default), each trace records a screencast and renders it as a film strip. You can hover over the film strip to see a magnified image of for each action and state which helps you easily find the action you want to inspect.
双击某个操作以查看该操作的时间范围。你可以使用时间轴中的滑块来增加选择的操作,这些操作将显示在“操作”选项卡中,所有控制台日志和网络日志将被过滤,仅显示所选操作的日志。
🌐 Double click on an action to see the time range for that action. You can use the slider in the timeline to increase the actions selected and these will be shown in the Actions tab and all console logs and network logs will be filtered to only show the logs for the actions selected.
快照
🌐 Snapshots
在启用 快照 选项(默认)进行跟踪时,Playwright 会为每个操作捕获一组完整的 DOM 快照。根据操作类型,它将捕获:
🌐 When tracing with the snapshots option turned on (default), Playwright captures a set of complete DOM snapshots for each action. Depending on the type of the action, it will capture:
| 类型 | 描述 |
|---|---|
| 之前 | 在调用动作时的快照。 |
| 动作 | 在执行输入的瞬间的快照。这种类型的快照在探索 Playwright 点击的具体位置时特别有用。 |
| 之后 | 动作之后的快照。 |
典型的操作快照如下所示:
🌐 Here is what the typical Action snapshot looks like:
请注意它如何高亮 DOM 节点以及确切的单击位置。
🌐 Notice how it highlights both, the DOM Node as well as the exact click position.
来源
🌐 Source
当你单击侧边栏中的某个操作时,该操作的代码行将在源面板中高亮。
🌐 When you click on an action in the sidebar, the line of code for that action is highlighted in the source panel.
调用
🌐 Call
调用选项卡向你显示有关操作的信息,例如所花费的时间、使用的定位器、是否处于严格模式以及使用的键。
🌐 The call tab shows you information about the action such as the time it took, what locator was used, if in strict mode and what key was used.
日志
🌐 Log
查看测试的完整日志,以更好地了解 Playwright 在幕后所做的事情,例如滚动到视图中、等待元素可见、启用和稳定以及执行单击、填充、按下等操作。
🌐 See a full log of your test to better understand what Playwright is doing behind the scenes such as scrolling into view, waiting for element to be visible, enabled and stable and performing actions such as click, fill, press etc.
错误
🌐 Errors
如果你的测试失败,你将在“错误”标签中看到每个测试的错误信息。时间轴上也会显示一条红线,标出错误发生的位置。你还可以点击“源代码”标签,查看错误发生在源代码的哪一行。
🌐 If your test fails you will see the error messages for each test in the Errors tab. The timeline will also show a red line highlighting where the error occurred. You can also click on the source tab to see on which line of the source code the error is.
控制台
🌐 Console
查看来自浏览器以及测试的控制台日志。会显示不同的图标,以告诉你控制台日志是来自浏览器还是测试文件。
🌐 See console logs from the browser as well as from your test. Different icons are displayed to show you if the console log came from the browser or from the test file.
在操作侧边栏中双击测试中的某个操作。这将筛选控制台,只显示在该操作期间生成的日志。点击显示全部按钮可以再次查看所有控制台日志。
🌐 Double click on an action from your test in the actions sidebar. This will filter the console to only show the logs that were made during that action. Click the Show all button to see all console logs again.
使用时间轴来筛选操作,方法是点击起点并拖动到终点。控制台选项卡也将仅显示在所选操作期间生成的日志。
🌐 Use the timeline to filter actions, by clicking a start point and dragging to an ending point. The console tab will also be filtered to only show the logs that were made during the actions selected.
网络
🌐 Network
网络选项卡显示了在测试期间发出的所有网络请求。你可以按请求类型、状态码、方法、请求、内容类型、持续时间和大小进行排序。点击某个请求可以查看更多信息,例如请求头、响应头、请求体和响应体。
🌐 The Network tab shows you all the network requests that were made during your test. You can sort by different types of requests, status code, method, request, content type, duration and size. Click on a request to see more information about it such as the request headers, response headers, request body and response body.
在操作侧边栏中双击测试中的某个操作。这将过滤网络请求,只显示在该操作期间发出的请求。点击显示全部按钮可以再次查看所有网络请求。
🌐 Double click on an action from your test in the actions sidebar. This will filter the network requests to only show the requests that were made during that action. Click the Show all button to see all network requests again.
使用时间轴来过滤操作,方法是点击起点并拖动到终点。网络标签也将被过滤,只显示所选操作期间发生的网络请求。
🌐 Use the timeline to filter actions, by clicking a start point and dragging to an ending point. The network tab will also be filtered to only show the network requests that were made during the actions selected.
元数据
🌐 Metadata
在“操作”选项卡旁边,你会看到“元数据”选项卡,它将显示有关你的测试的更多信息,例如浏览器、视口大小、测试持续时间等。
🌐 Next to the Actions tab you will find the Metadata tab which will show you more information on your test such as the Browser, viewport size, test duration and more.